33
/es/
AIzaSyAYiBZKx7MnpbEhh9jyipgxe19OcubqV5w
August 1, 2025
286356
Zambia
ZMB
true
2
1
Persistence to grade 5, female (% of cohort)
2013,2010,2009,2008,2007,2006,2000,1999,1985,1984,1983,1982,1981,1980,1979,1978,1977,1976,1975,1974,1973
Download
Estadísticas Globales de la Biblioteca →Zambia →

Persistence to grade 5, female (% of cohort)

Estas estadísticas en otros países:

AfghanistanAlbaniaAlgeriaAndorraAngolaAntigua and BarbudaArab WorldArgentinaArubaBahamas, TheBahrainBangladeshBarbadosBelgiumBelizeBeninBermudaBhutanBoliviaBosnia and HerzegovinaBotswanaBrunei DarussalamBurkina FasoBurundiCabo VerdeCambodiaCameroonCanadaCaribbean small statesCayman IslandsCentral African RepublicChadChileChinaColombiaComorosCongo, Dem. Rep.Congo, Rep.Costa RicaCote d'IvoireCubaCyprusCzech RepublicDenmarkDjiboutiDominicaDominican RepublicEarly-demographic dividendEast Asia & PacificEast Asia & Pacific (excluding high income)East Asia & Pacific (IDA & IBRD countries)EcuadorEgypt, Arab Rep.El SalvadorEquatorial GuineaEritreaEstoniaEthiopiaFijiFinlandFranceGabonGambia, TheGeorgiaGhanaGreeceGrenadaGuatemalaGuineaGuinea-BissauGuyanaHaitiHeavily indebted poor countries (HIPC)HondurasHong Kong SAR, ChinaHungaryIcelandIDA blendIDA onlyIDA totalIndiaIndonesiaIran, Islamic Rep.IraqIrelandIsraelItalyJamaicaJapanJordanKenyaKiribatiKorea, Rep.KuwaitLao PDRLate-demographic dividendLatviaLeast developed countries: UN classificationLebanonLesothoLiberiaLibyaLiechtensteinLow incomeLower middle incomeLuxembourgMacao SAR, ChinaMadagascarMalawiMalaysiaMaldivesMaliMaltaMarshall IslandsMauritaniaMauritiusMexicoMiddle East & North AfricaMiddle East & North Africa (excluding high income)Middle East & North Africa (IDA & IBRD countries)MontenegroMoroccoMozambiqueMyanmarNamibiaNepalNetherlandsNicaraguaNigerNigeriaNorwayOmanOther small statesPacific island small statesPakistanPanamaPapua New GuineaParaguayPeruPhilippinesPolandPortugalPre-demographic dividendQatarRwandaSamoaSan MarinoSao Tome and PrincipeSaudi ArabiaSenegalSeychellesSierra LeoneSingaporeSloveniaSolomon IslandsSouth AfricaSouth AsiaSouth Asia (IDA & IBRD)SpainSri LankaSt. Kitts and NevisSt. LuciaSt. Vincent and the GrenadinesSub-Saharan Africa Sub-Saharan Africa (excluding high income)Sub-Saharan Africa (IDA & IBRD countries)SudanSurinameSwazilandSwedenSwitzerlandSyrian Arab RepublicTanzaniaThailandTimor-LesteTogoTongaTrinidad and TobagoTunisiaTurkeyUgandaUnited Arab EmiratesUpper middle incomeUruguayVanuatuVenezuela, RBVietnamYemen, Rep.ZambiaZimbabwe

línea de tiempo (timeline):

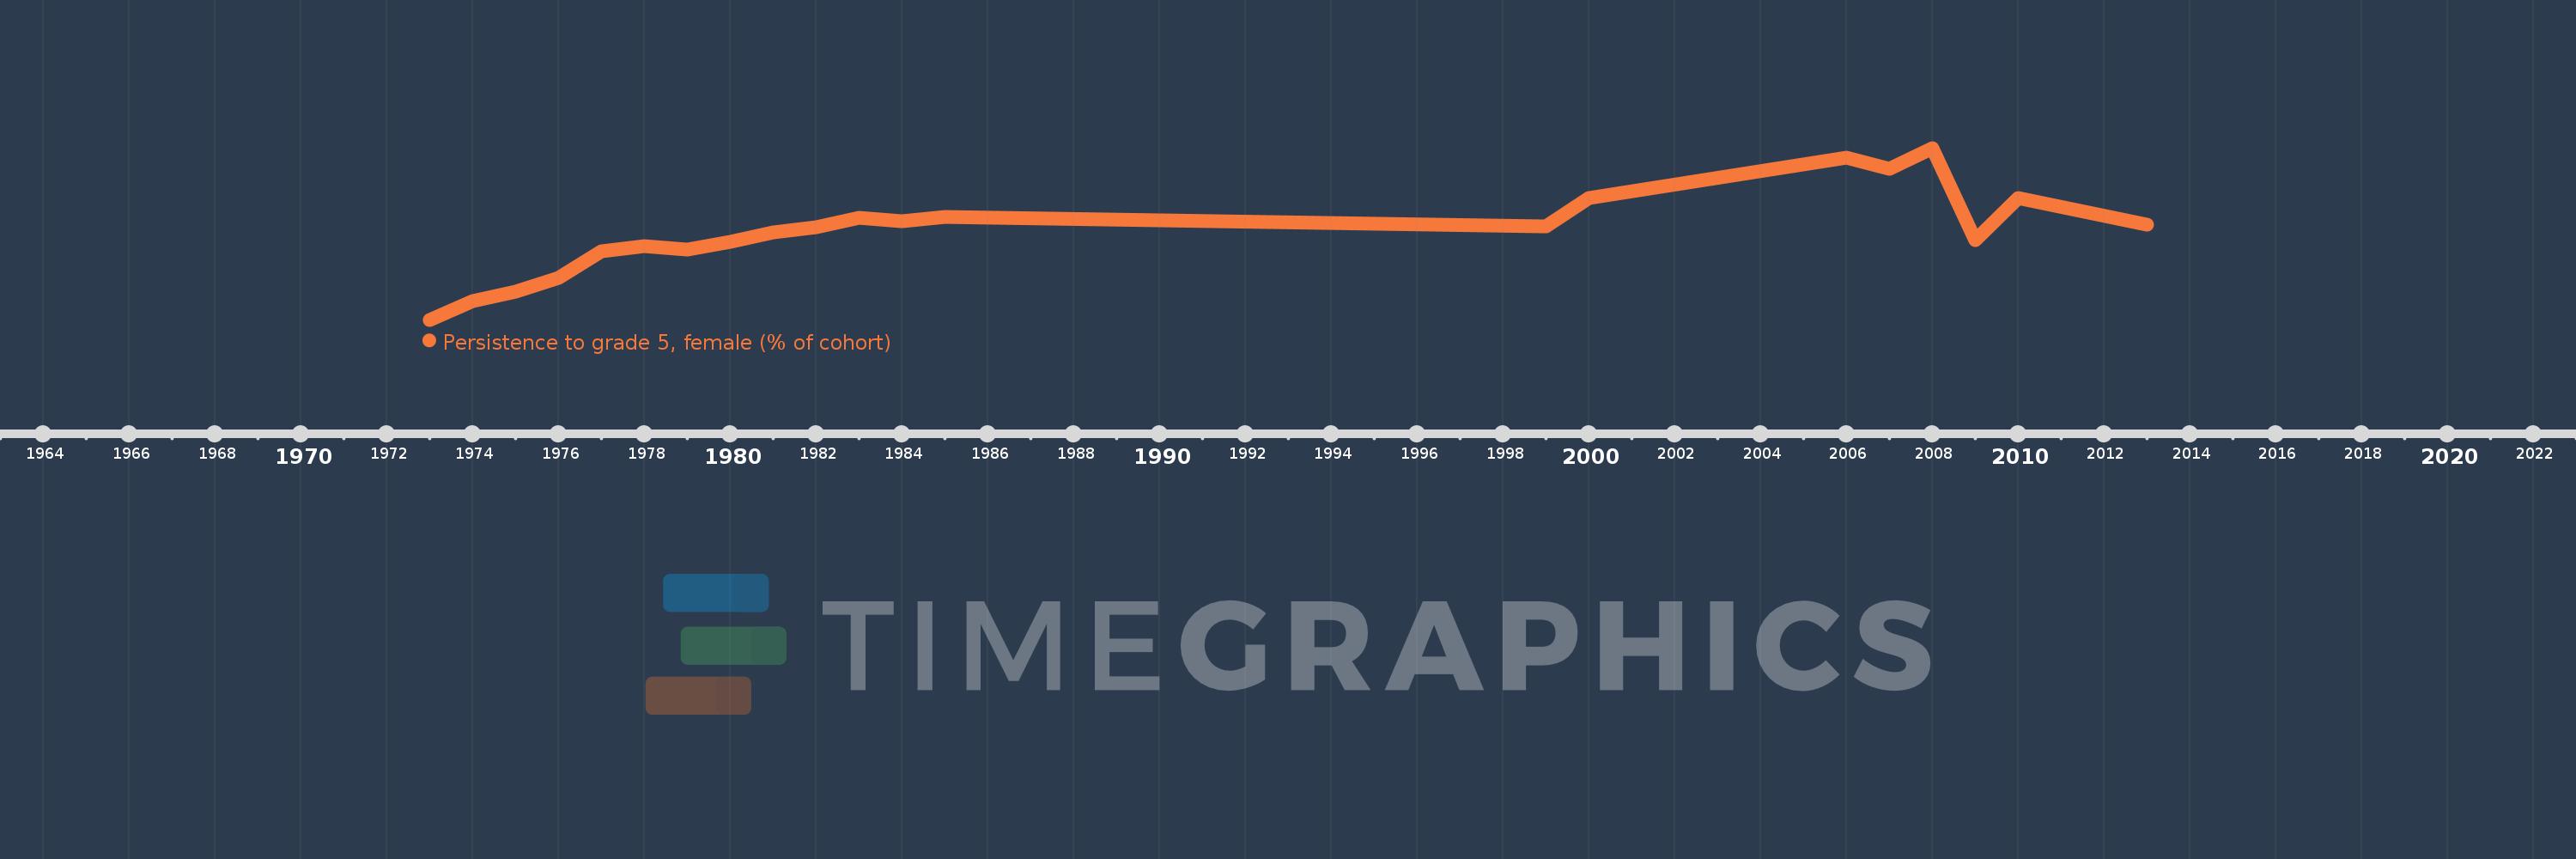
En esta escala de tiempo se presenta un gráfico de 1973 y 2013 de Zambia. Los datos de 1972 están ausentes. El número de observaciones reales por fecha: 21.

Fuente (nombre):

Indicadores del desarrollo mundial

Fuente (organización):

United Nations Educational, Scientific, and Cultural Organization (UNESCO) Institute for Statistics.

Categorías:

Education, Gender

Se ha actualizado:

23 abr 2017 año

Los indicadores de los cambios de valor en los últimos años

En promedio:
72.122
Mínimo:
56.108
1 ene 1973 año
Máximo:
87.179
1 ene 2008 año
A la fecha de observación
Valor
Cambio absoluto
El cambio con respecto al valor anterior
1 ene 1973 año
56.108
+56.108
0.0%
1 ene 1974 año
59.447
+3.338
5.95%
1 ene 1975 año
61.171
+1.724
2.9%
1 ene 1976 año
63.682
+2.512
4.11%
1 ene 1977 año
68.553
+4.871
7.65%
1 ene 1978 año
69.444
+0.891
1.3%
1 ene 1979 año
68.876
-0.569
-0.82%
1 ene 1980 año
70.148
+1.272
1.85%
1 ene 1981 año
71.96
+1.812
2.58%
1 ene 1982 año
72.86
+0.9
1.25%
1 ene 1983 año
74.62
+1.76
2.42%
1 ene 1984 año
73.969
-0.651
-0.87%
1 ene 1985 año
74.663
+0.694
0.94%
1 ene 1999 año
73.025
-1.638
-2.19%
1 ene 2000 año
78.103
+5.078
6.95%
1 ene 2006 año
85.394
+7.291
9.34%
1 ene 2007 año
83.437
-1.958
-2.29%
1 ene 2008 año
87.179
+3.742
4.48%
1 ene 2009 año
70.444
-16.734
-19.2%
1 ene 2010 año
78.175
+7.731
10.97%
1 ene 2013 año
73.296
-4.88
-6.24%

Ranking de los países por los datos estadísticos actuales