33
/es/
AIzaSyAYiBZKx7MnpbEhh9jyipgxe19OcubqV5w
August 1, 2025
215682
Oman
OMN
true
2
1
Persistence to grade 5, female (% of cohort)
2013,2012,2003,2002,2001,2000,1999,1995,1991,1990,1989,1988,1987,1986,1985,1984,1980,1976,1975
Download
Estadísticas Globales de la Biblioteca →Oman →

Persistence to grade 5, female (% of cohort)

Estas estadísticas en otros países:

AfghanistanAlbaniaAlgeriaAndorraAngolaAntigua and BarbudaArab WorldArgentinaArubaBahamas, TheBahrainBangladeshBarbadosBelgiumBelizeBeninBermudaBhutanBoliviaBosnia and HerzegovinaBotswanaBrunei DarussalamBurkina FasoBurundiCabo VerdeCambodiaCameroonCanadaCaribbean small statesCayman IslandsCentral African RepublicChadChileChinaColombiaComorosCongo, Dem. Rep.Congo, Rep.Costa RicaCote d'IvoireCubaCyprusCzech RepublicDenmarkDjiboutiDominicaDominican RepublicEarly-demographic dividendEast Asia & PacificEast Asia & Pacific (excluding high income)East Asia & Pacific (IDA & IBRD countries)EcuadorEgypt, Arab Rep.El SalvadorEquatorial GuineaEritreaEstoniaEthiopiaFijiFinlandFranceGabonGambia, TheGeorgiaGhanaGreeceGrenadaGuatemalaGuineaGuinea-BissauGuyanaHaitiHeavily indebted poor countries (HIPC)HondurasHong Kong SAR, ChinaHungaryIcelandIDA blendIDA onlyIDA totalIndiaIndonesiaIran, Islamic Rep.IraqIrelandIsraelItalyJamaicaJapanJordanKenyaKiribatiKorea, Rep.KuwaitLao PDRLate-demographic dividendLatviaLeast developed countries: UN classificationLebanonLesothoLiberiaLibyaLiechtensteinLow incomeLower middle incomeLuxembourgMacao SAR, ChinaMadagascarMalawiMalaysiaMaldivesMaliMaltaMarshall IslandsMauritaniaMauritiusMexicoMiddle East & North AfricaMiddle East & North Africa (excluding high income)Middle East & North Africa (IDA & IBRD countries)MontenegroMoroccoMozambiqueMyanmarNamibiaNepalNetherlandsNicaraguaNigerNigeriaNorwayOmanOther small statesPacific island small statesPakistanPanamaPapua New GuineaParaguayPeruPhilippinesPolandPortugalPre-demographic dividendQatarRwandaSamoaSan MarinoSao Tome and PrincipeSaudi ArabiaSenegalSeychellesSierra LeoneSingaporeSloveniaSolomon IslandsSouth AfricaSouth AsiaSouth Asia (IDA & IBRD)SpainSri LankaSt. Kitts and NevisSt. LuciaSt. Vincent and the GrenadinesSub-Saharan Africa Sub-Saharan Africa (excluding high income)Sub-Saharan Africa (IDA & IBRD countries)SudanSurinameSwazilandSwedenSwitzerlandSyrian Arab RepublicTanzaniaThailandTimor-LesteTogoTongaTrinidad and TobagoTunisiaTurkeyUgandaUnited Arab EmiratesUpper middle incomeUruguayVanuatuVenezuela, RBVietnamYemen, Rep.ZambiaZimbabwe

línea de tiempo (timeline):

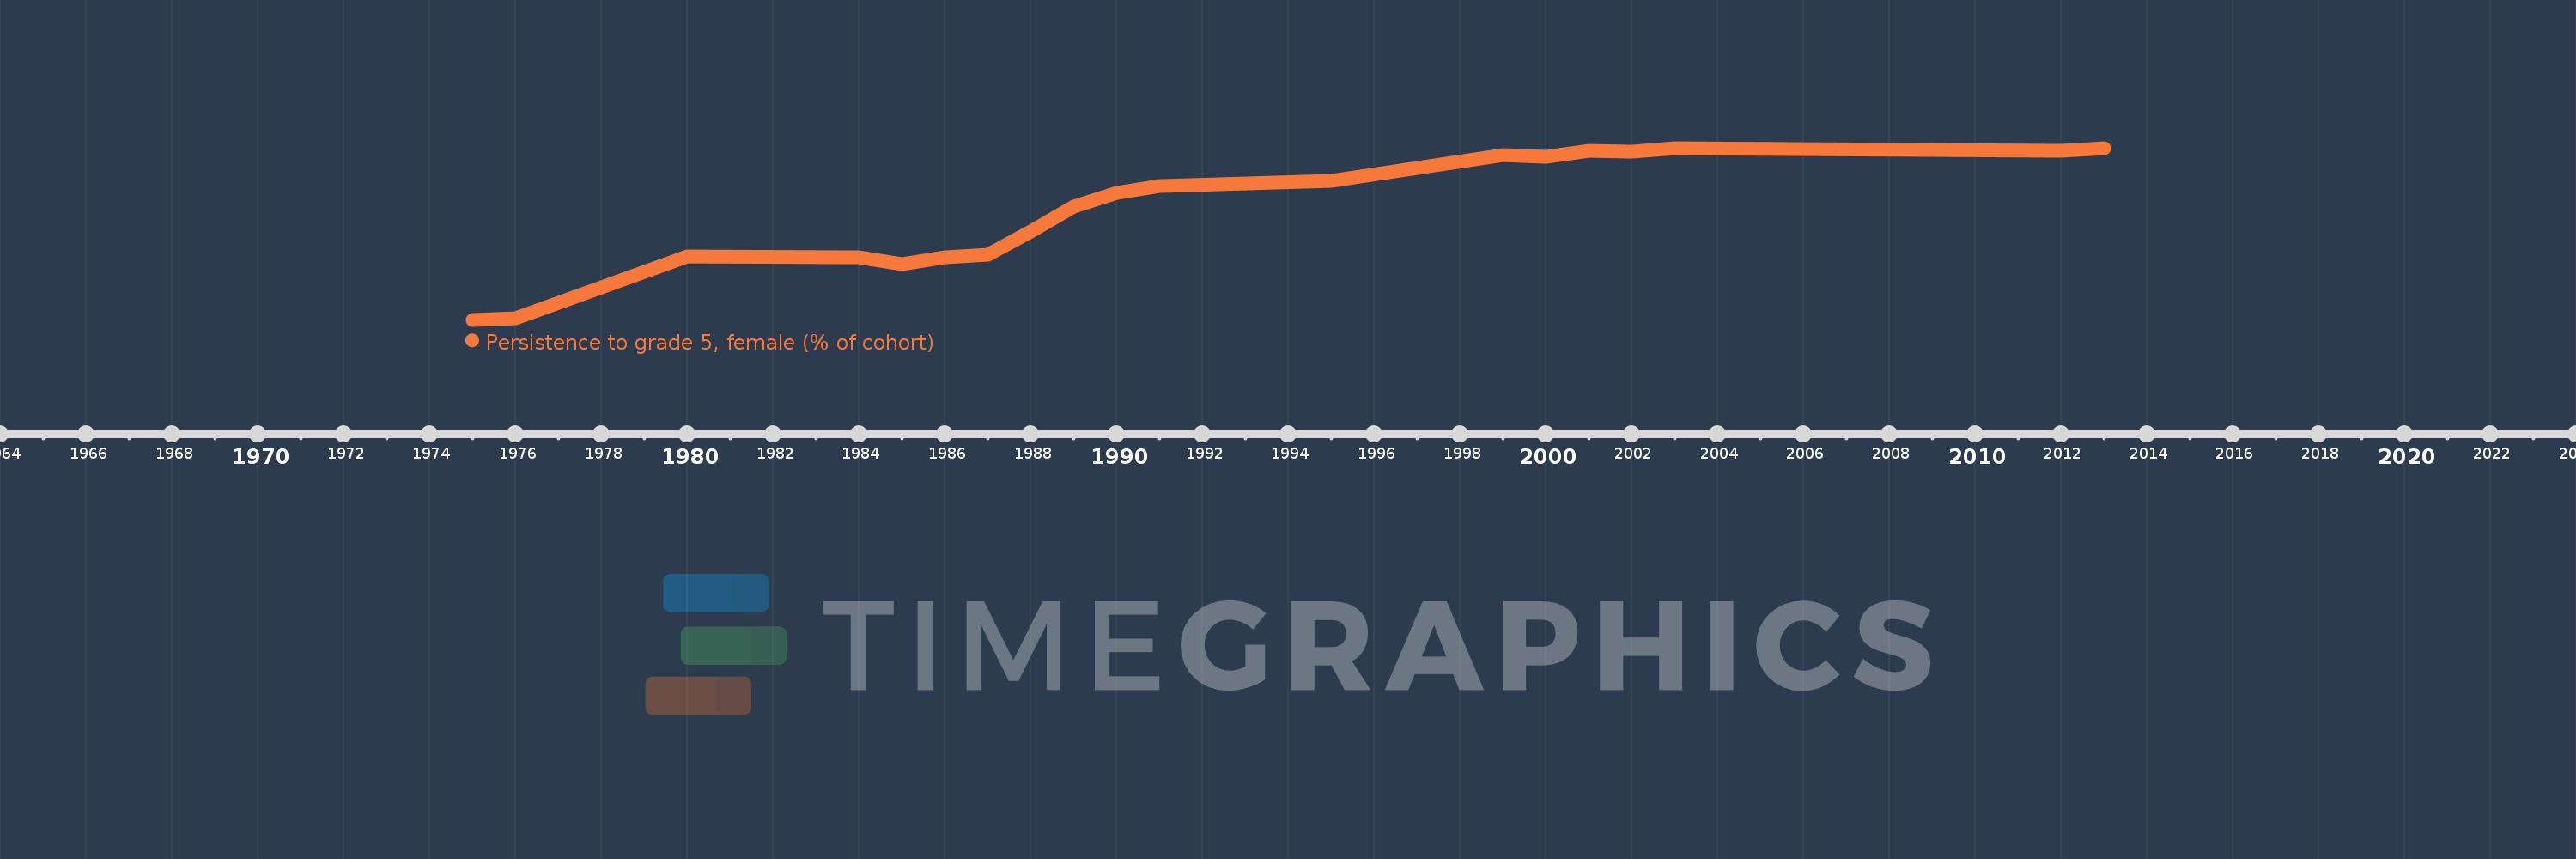
En esta escala de tiempo se presenta un gráfico de 1975 y 2013 de Oman. Los datos de 1974 están ausentes. El número de observaciones reales por fecha: 19.

Fuente (nombre):

Indicadores del desarrollo mundial

Fuente (organización):

United Nations Educational, Scientific, and Cultural Organization (UNESCO) Institute for Statistics.

Categorías:

Education, Gender

Se ha actualizado:

23 abr 2017 año

Los indicadores de los cambios de valor en los últimos años

En promedio:
64.775
Mínimo:
5.051
1 ene 1975 año
Máximo:
98.424
1 ene 2013 año
A la fecha de observación
Valor
Cambio absoluto
El cambio con respecto al valor anterior
1 ene 1975 año
5.051
+5.051
0.0%
1 ene 1976 año
5.977
+0.926
18.34%
1 ene 1980 año
39.462
+33.485
560.24%
1 ene 1984 año
38.822
-0.64
-1.62%
1 ene 1985 año
35.418
-3.405
-8.77%
1 ene 1986 año
38.761
+3.343
9.44%
1 ene 1987 año
40.45
+1.689
4.36%
1 ene 1988 año
53.157
+12.707
31.41%
1 ene 1989 año
66.484
+13.326
25.07%
1 ene 1990 año
74.048
+7.565
11.38%
1 ene 1991 año
77.709
+3.661
4.94%
1 ene 1995 año
80.559
+2.85
3.67%
1 ene 1999 año
94.534
+13.974
17.35%
1 ene 2000 año
93.812
-0.722
-0.76%
1 ene 2001 año
96.71
+2.899
3.09%
1 ene 2002 año
96.422
-0.289
-0.3%
1 ene 2003 año
98.052
+1.63
1.69%
1 ene 2012 año
96.864
-1.188
-1.21%
1 ene 2013 año
98.424
+1.56
1.61%

Ranking de los países por los datos estadísticos actuales