33
/es/
AIzaSyAYiBZKx7MnpbEhh9jyipgxe19OcubqV5w
August 1, 2025
188264
Malaysia
MYS
true
2
1
Persistence to grade 5, female (% of cohort)
2014,2007,2006,2005,2003,2002,1994,1992,1991,1990,1989,1988,1986,1985,1984,1983,1982,1981,1975
Download
Estadísticas Globales de la Biblioteca →Malaysia →

Persistence to grade 5, female (% of cohort)

Estas estadísticas en otros países:

AfghanistanAlbaniaAlgeriaAndorraAngolaAntigua and BarbudaArab WorldArgentinaArubaBahamas, TheBahrainBangladeshBarbadosBelgiumBelizeBeninBermudaBhutanBoliviaBosnia and HerzegovinaBotswanaBrunei DarussalamBurkina FasoBurundiCabo VerdeCambodiaCameroonCanadaCaribbean small statesCayman IslandsCentral African RepublicChadChileChinaColombiaComorosCongo, Dem. Rep.Congo, Rep.Costa RicaCote d'IvoireCubaCyprusCzech RepublicDenmarkDjiboutiDominicaDominican RepublicEarly-demographic dividendEast Asia & PacificEast Asia & Pacific (excluding high income)East Asia & Pacific (IDA & IBRD countries)EcuadorEgypt, Arab Rep.El SalvadorEquatorial GuineaEritreaEstoniaEthiopiaFijiFinlandFranceGabonGambia, TheGeorgiaGhanaGreeceGrenadaGuatemalaGuineaGuinea-BissauGuyanaHaitiHeavily indebted poor countries (HIPC)HondurasHong Kong SAR, ChinaHungaryIcelandIDA blendIDA onlyIDA totalIndiaIndonesiaIran, Islamic Rep.IraqIrelandIsraelItalyJamaicaJapanJordanKenyaKiribatiKorea, Rep.KuwaitLao PDRLate-demographic dividendLatviaLeast developed countries: UN classificationLebanonLesothoLiberiaLibyaLiechtensteinLow incomeLower middle incomeLuxembourgMacao SAR, ChinaMadagascarMalawiMalaysiaMaldivesMaliMaltaMarshall IslandsMauritaniaMauritiusMexicoMiddle East & North AfricaMiddle East & North Africa (excluding high income)Middle East & North Africa (IDA & IBRD countries)MontenegroMoroccoMozambiqueMyanmarNamibiaNepalNetherlandsNicaraguaNigerNigeriaNorwayOmanOther small statesPacific island small statesPakistanPanamaPapua New GuineaParaguayPeruPhilippinesPolandPortugalPre-demographic dividendQatarRwandaSamoaSan MarinoSao Tome and PrincipeSaudi ArabiaSenegalSeychellesSierra LeoneSingaporeSloveniaSolomon IslandsSouth AfricaSouth AsiaSouth Asia (IDA & IBRD)SpainSri LankaSt. Kitts and NevisSt. LuciaSt. Vincent and the GrenadinesSub-Saharan Africa Sub-Saharan Africa (excluding high income)Sub-Saharan Africa (IDA & IBRD countries)SudanSurinameSwazilandSwedenSwitzerlandSyrian Arab RepublicTanzaniaThailandTimor-LesteTogoTongaTrinidad and TobagoTunisiaTurkeyUgandaUnited Arab EmiratesUpper middle incomeUruguayVanuatuVenezuela, RBVietnamYemen, Rep.ZambiaZimbabwe

línea de tiempo (timeline):

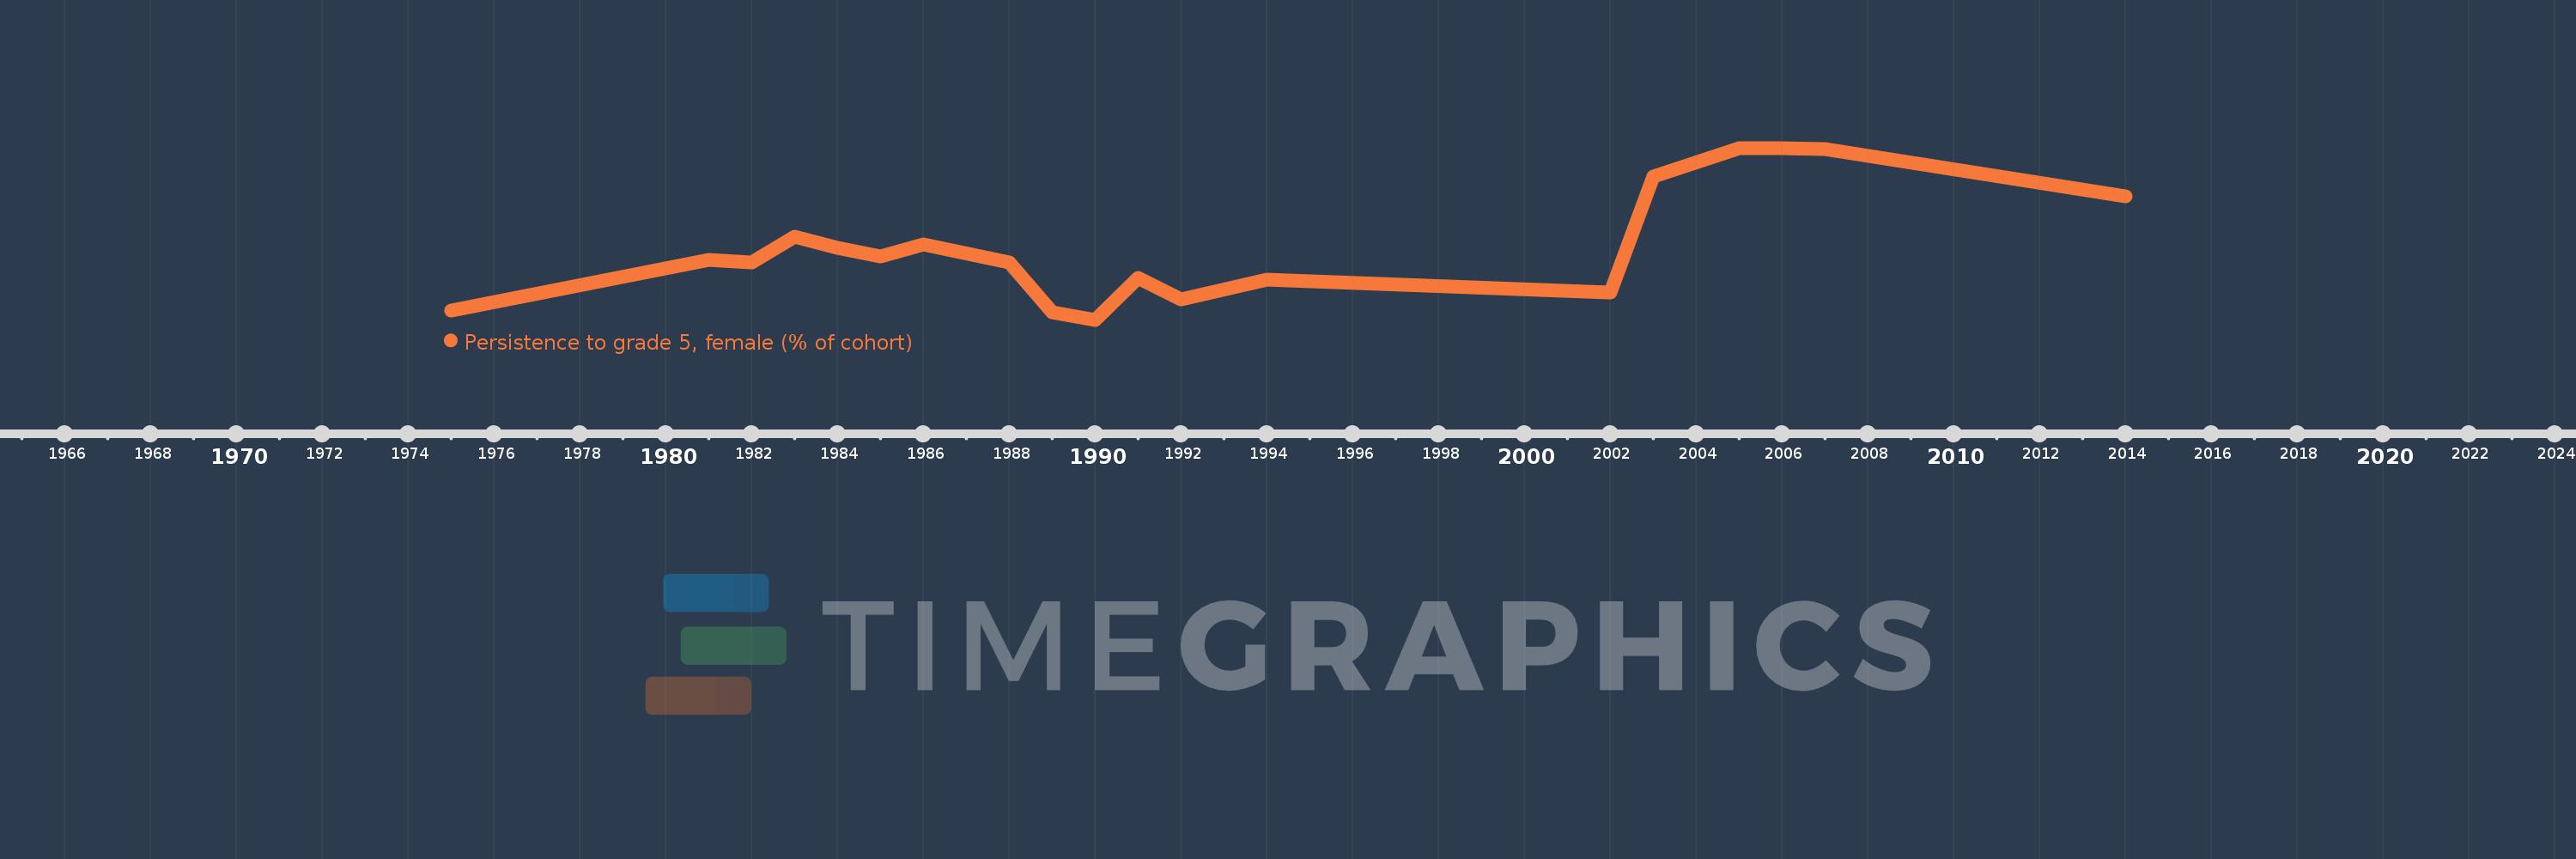
En esta escala de tiempo se presenta un gráfico de 1975 y 2014 de Malaysia. Los datos de 1974 están ausentes. El número de observaciones reales por fecha: 19.

Fuente (nombre):

Indicadores del desarrollo mundial

Fuente (organización):

United Nations Educational, Scientific, and Cultural Organization (UNESCO) Institute for Statistics.

Categorías:

Education, Gender

Se ha actualizado:

23 abr 2017 año

Los indicadores de los cambios de valor en los últimos años

En promedio:
91.327
Mínimo:
84.866
1 ene 1990 año
Máximo:
100.0
1 ene 2006 año
A la fecha de observación
Valor
Cambio absoluto
El cambio con respecto al valor anterior
1 ene 1975 año
85.683
+85.683
0.0%
1 ene 1981 año
90.161
+4.478
5.23%
1 ene 1982 año
89.904
-0.258
-0.29%
1 ene 1983 año
92.156
+2.252
2.5%
1 ene 1984 año
91.18
-0.976
-1.06%
1 ene 1985 año
90.415
-0.765
-0.84%
1 ene 1986 año
91.506
+1.09
1.21%
1 ene 1988 año
89.88
-1.626
-1.78%
1 ene 1989 año
85.545
-4.335
-4.82%
1 ene 1990 año
84.866
-0.678
-0.79%
1 ene 1991 año
88.568
+3.701
4.36%
1 ene 1992 año
86.626
-1.942
-2.19%
1 ene 1994 año
88.406
+1.781
2.06%
1 ene 2002 año
87.273
-1.134
-1.28%
1 ene 2003 año
97.476
+10.203
11.69%
1 ene 2005 año
99.97
+2.495
2.56%
1 ene 2006 año
100.0
+0.03
0.03%
1 ene 2007 año
99.865
-0.135
-0.13%
1 ene 2014 año
95.736
-4.13
-4.14%

Ranking de los países por los datos estadísticos actuales