33
/es/
AIzaSyAYiBZKx7MnpbEhh9jyipgxe19OcubqV5w
August 1, 2025
144862
Guatemala
GTM
true
2
1
Persistence to grade 5, female (% of cohort)
2014,2013,2012,2011,2010,2009,2008,2007,2006,2005,2002,2001,2000,1997,1979,1978,1977
Download
Estadísticas Globales de la Biblioteca →Guatemala →

Persistence to grade 5, female (% of cohort)

Estas estadísticas en otros países:

AfghanistanAlbaniaAlgeriaAndorraAngolaAntigua and BarbudaArab WorldArgentinaArubaBahamas, TheBahrainBangladeshBarbadosBelgiumBelizeBeninBermudaBhutanBoliviaBosnia and HerzegovinaBotswanaBrunei DarussalamBurkina FasoBurundiCabo VerdeCambodiaCameroonCanadaCaribbean small statesCayman IslandsCentral African RepublicChadChileChinaColombiaComorosCongo, Dem. Rep.Congo, Rep.Costa RicaCote d'IvoireCubaCyprusCzech RepublicDenmarkDjiboutiDominicaDominican RepublicEarly-demographic dividendEast Asia & PacificEast Asia & Pacific (excluding high income)East Asia & Pacific (IDA & IBRD countries)EcuadorEgypt, Arab Rep.El SalvadorEquatorial GuineaEritreaEstoniaEthiopiaFijiFinlandFranceGabonGambia, TheGeorgiaGhanaGreeceGrenadaGuatemalaGuineaGuinea-BissauGuyanaHaitiHeavily indebted poor countries (HIPC)HondurasHong Kong SAR, ChinaHungaryIcelandIDA blendIDA onlyIDA totalIndiaIndonesiaIran, Islamic Rep.IraqIrelandIsraelItalyJamaicaJapanJordanKenyaKiribatiKorea, Rep.KuwaitLao PDRLate-demographic dividendLatviaLeast developed countries: UN classificationLebanonLesothoLiberiaLibyaLiechtensteinLow incomeLower middle incomeLuxembourgMacao SAR, ChinaMadagascarMalawiMalaysiaMaldivesMaliMaltaMarshall IslandsMauritaniaMauritiusMexicoMiddle East & North AfricaMiddle East & North Africa (excluding high income)Middle East & North Africa (IDA & IBRD countries)MontenegroMoroccoMozambiqueMyanmarNamibiaNepalNetherlandsNicaraguaNigerNigeriaNorwayOmanOther small statesPacific island small statesPakistanPanamaPapua New GuineaParaguayPeruPhilippinesPolandPortugalPre-demographic dividendQatarRwandaSamoaSan MarinoSao Tome and PrincipeSaudi ArabiaSenegalSeychellesSierra LeoneSingaporeSloveniaSolomon IslandsSouth AfricaSouth AsiaSouth Asia (IDA & IBRD)SpainSri LankaSt. Kitts and NevisSt. LuciaSt. Vincent and the GrenadinesSub-Saharan Africa Sub-Saharan Africa (excluding high income)Sub-Saharan Africa (IDA & IBRD countries)SudanSurinameSwazilandSwedenSwitzerlandSyrian Arab RepublicTanzaniaThailandTimor-LesteTogoTongaTrinidad and TobagoTunisiaTurkeyUgandaUnited Arab EmiratesUpper middle incomeUruguayVanuatuVenezuela, RBVietnamYemen, Rep.ZambiaZimbabwe

línea de tiempo (timeline):

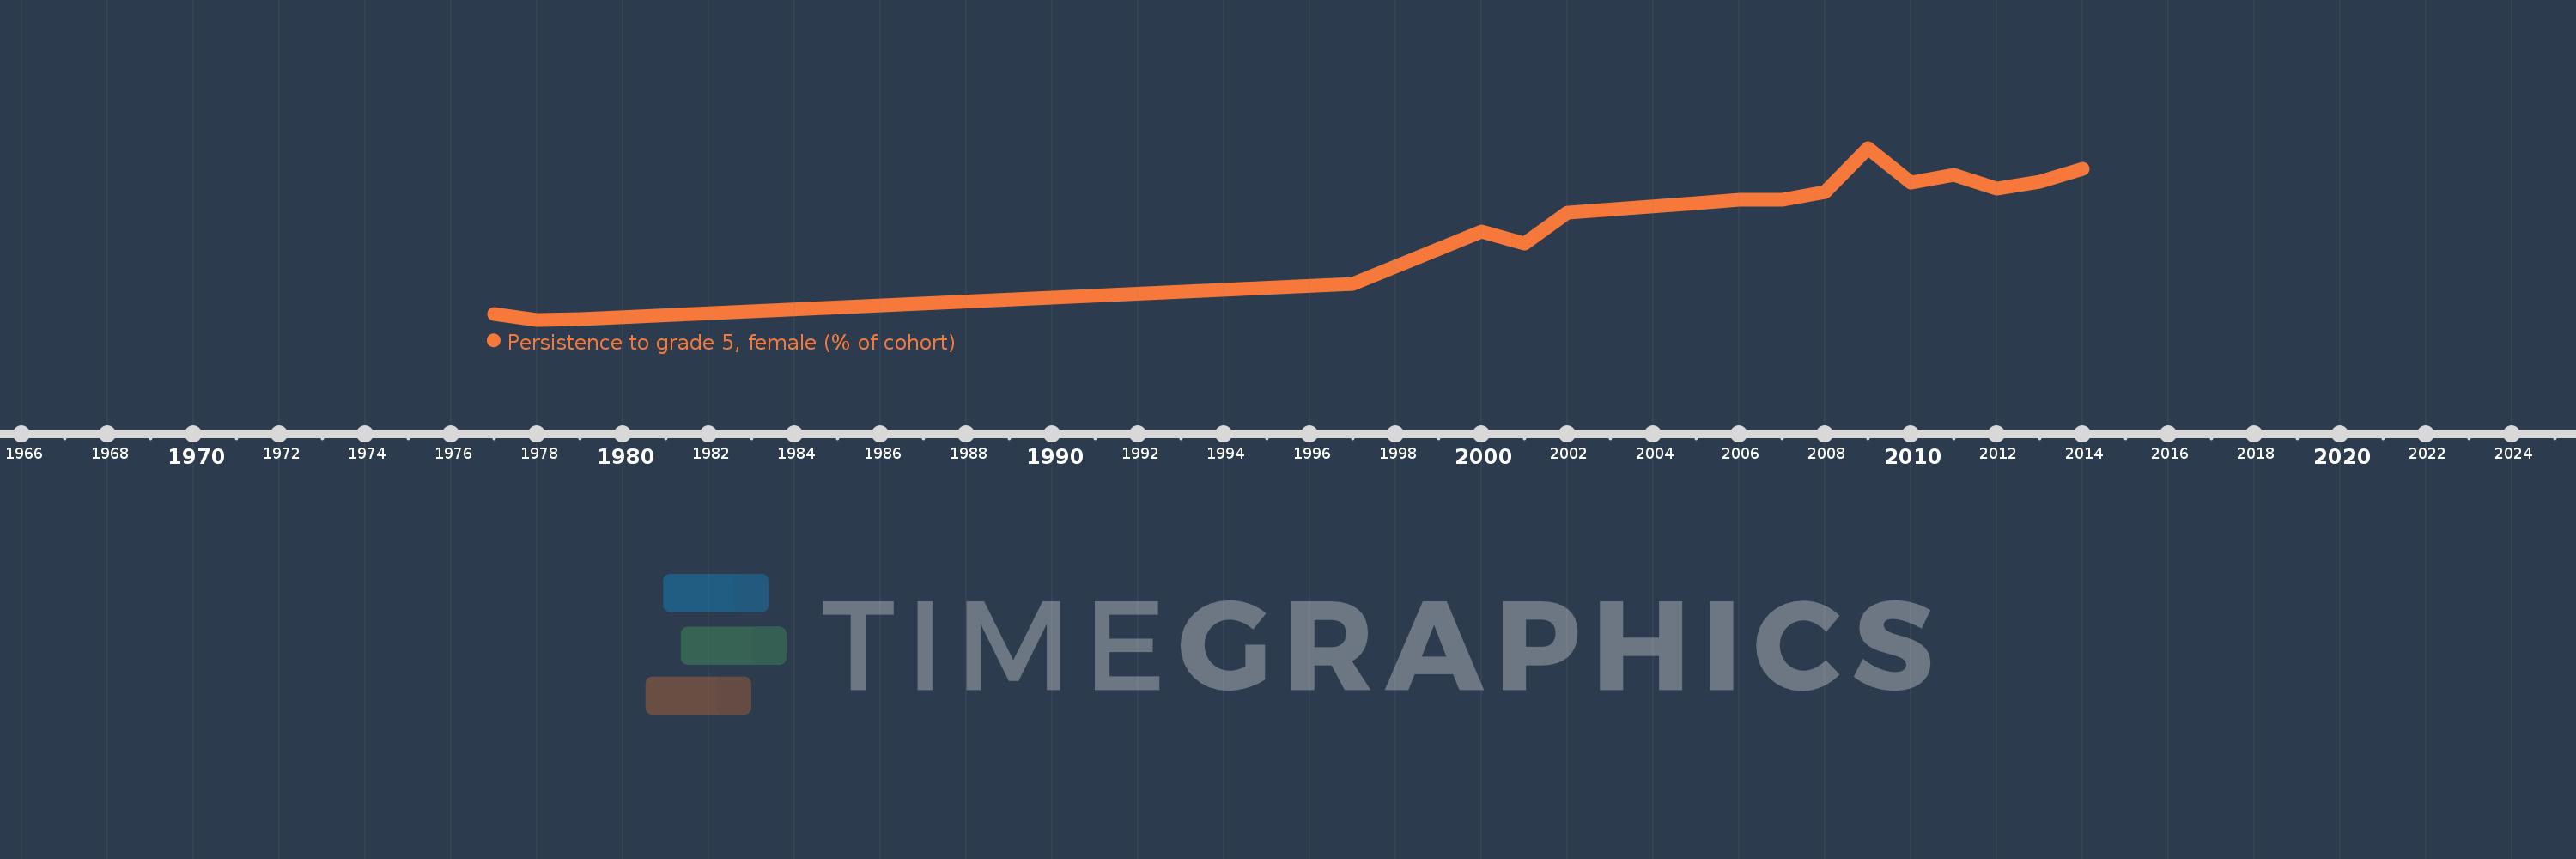
En esta escala de tiempo se presenta un gráfico de 1977 y 2014 de Guatemala. Los datos de 1976 están ausentes. El número de observaciones reales por fecha: 17.

Fuente (nombre):

Indicadores del desarrollo mundial

Fuente (organización):

United Nations Educational, Scientific, and Cultural Organization (UNESCO) Institute for Statistics.

Categorías:

Education, Gender

Se ha actualizado:

23 abr 2017 año

Los indicadores de los cambios de valor en los últimos años

En promedio:
60.834
Mínimo:
30.58
1 ene 1978 año
Máximo:
83.433
1 ene 2009 año
A la fecha de observación
Valor
Cambio absoluto
El cambio con respecto al valor anterior
1 ene 1977 año
32.24
+32.24
0.0%
1 ene 1978 año
30.58
-1.66
-5.15%
1 ene 1979 año
30.663
+0.083
0.27%
1 ene 1997 año
41.604
+10.941
35.68%
1 ene 2000 año
57.815
+16.211
38.97%
1 ene 2001 año
54.005
-3.81
-6.59%
1 ene 2002 año
63.661
+9.656
17.88%
1 ene 2005 año
66.349
+2.688
4.22%
1 ene 2006 año
67.618
+1.27
1.91%
1 ene 2007 año
67.507
-0.112
-0.17%
1 ene 2008 año
69.813
+2.307
3.42%
1 ene 2009 año
83.433
+13.619
19.51%
1 ene 2010 año
72.762
-10.671
-12.79%
1 ene 2011 año
75.115
+2.353
3.23%
1 ene 2012 año
70.997
-4.119
-5.48%
1 ene 2013 año
73.02
+2.023
2.85%
1 ene 2014 año
77.003
+3.983
5.45%

Ranking de los países por los datos estadísticos actuales