29
/es/
es
AIzaSyAYiBZKx7MnpbEhh9jyipgxe19OcubqV5w
April 1, 2024
273601
Ukraine
UKR
true
2
1
GNI (constant LCU)
2016,2015,2014,2013,2012,2011,2010,2009,2008,2007,2006,2005,2004,2003,2002,2001,2000,1999,1998,1997,1996,1995,1994,1993,1992,1991
Download
Estadísticas Globales de la Biblioteca →Ukraine →

GNI (constant LCU)

Estas estadísticas en otros países:
AlbaniaAlgeriaAngolaAntigua and BarbudaArgentinaArmeniaAustraliaAustriaAzerbaijanBahamas, TheBahrainBangladeshBarbadosBelarusBelgiumBelizeBeninBhutanBoliviaBosnia and HerzegovinaBotswanaBrazilBrunei DarussalamBulgariaBurkina FasoBurundiCabo VerdeCambodiaCameroonCanadaChadChileChinaColombiaComorosCongo, Dem. Rep.Congo, Rep.Costa RicaCote d'IvoireCroatiaCubaCyprusCzech RepublicDenmarkDjiboutiDominican RepublicEcuadorEgypt, Arab Rep.El SalvadorEquatorial GuineaEritreaEstoniaEthiopiaFijiFinlandFranceGabonGambia, TheGeorgiaGermanyGhanaGreeceGuatemalaGuineaGuinea-BissauHaitiHondurasHong Kong SAR, ChinaHungaryIcelandIndiaIndonesiaIran, Islamic Rep.IrelandIsraelItalyJamaicaJapanJordanKazakhstanKenyaKorea, Rep.KosovoKuwaitKyrgyz RepublicLao PDRLatviaLebanonLiberiaLibyaLithuaniaLuxembourgMacao SAR, ChinaMacedonia, FYRMadagascarMalawiMalaysiaMaliMaltaMauritaniaMauritiusMexicoMoldovaMongoliaMontenegroMoroccoMozambiqueMyanmarNamibiaNepalNetherlandsNew ZealandNicaraguaNigerNigeriaNorwayOmanPakistanPanamaPapua New GuineaParaguayPeruPhilippinesPolandPortugalPuerto RicoQatarRomaniaRussian FederationRwandaSamoaSaudi ArabiaSenegalSerbiaSeychellesSierra LeoneSingaporeSlovak RepublicSloveniaSomaliaSouth AfricaSouth SudanSpainSri LankaSudanSurinameSwazilandSwedenSwitzerlandSyrian Arab RepublicTajikistanTanzaniaThailandTimor-LesteTogoTrinidad and TobagoTunisiaTurkeyTurkmenistanUgandaUkraineUnited Arab EmiratesUnited KingdomUnited StatesUruguayUzbekistanVanuatuVenezuela, RBVietnamWest Bank and GazaZambiaZimbabwe
línea de tiempo (timeline):
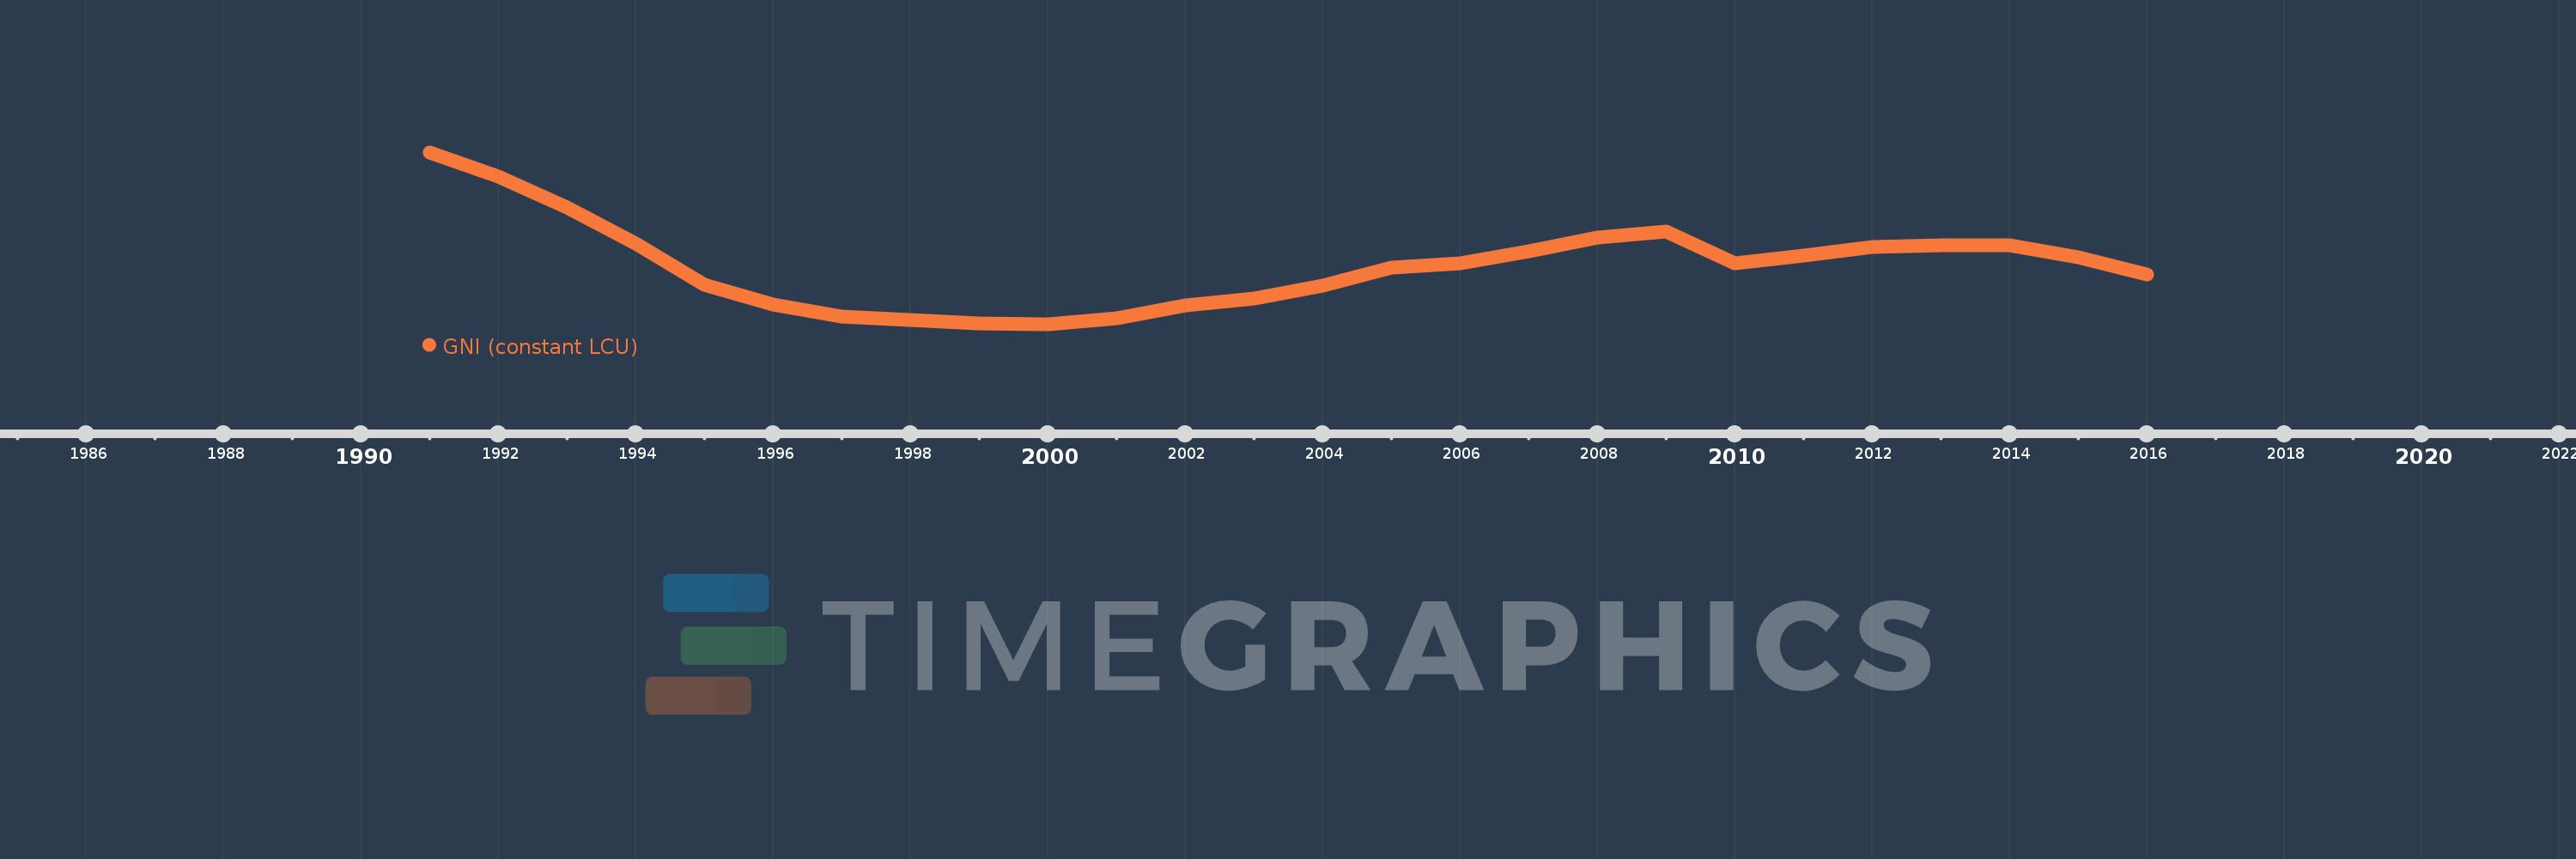
En esta escala de tiempo se presenta un gráfico de 1991 y 2016 de Ukraine. Los datos de 1990 están ausentes. El número de observaciones reales por fecha: 26.
Fuente (nombre):
Indicadores del desarrollo mundial
Fuente (organización):
World Bank national accounts data, and OECD National Accounts data files.
Categorías:
Economy & Growth
Se ha actualizado:
23 abr 2017 año
Los indicadores de los cambios de valor en los últimos años
En promedio:
1.002 billones
Mínimo:
651.719 bn
1 ene 2000 año
Máximo:
1.676 billones
1 ene 1991 año
A la fecha de observación
Valor
Cambio absoluto
El cambio con respecto al valor anterior
1 ene 1991 año
1.676 billones
+1.676 billones
0.0%
1 ene 1992 año
1.53 billones
-145.827 bn
-8.7%
1 ene 1993 año
1.349 billones
-181.015 bn
-11.83%
1 ene 1994 año
1.131 billones
-217.813 bn
-16.14%
1 ene 1995 año
886.911 bn
-244.444 bn
-21.61%
1 ene 1996 año
771.411 bn
-115.5 bn
-13.02%
1 ene 1997 año
696.489 bn
-74.922 bn
-9.71%
1 ene 1998 año
675.599 bn
-20.89 bn
-3.0%
1 ene 1999 año
657.737 bn
-17.863 bn
-2.64%
1 ene 2000 año
651.719 bn
-6.018 bn
-0.91%
1 ene 2001 año
688.402 bn
+36.684 bn
5.63%
1 ene 2002 año
761.801 bn
+73.398 bn
10.66%
1 ene 2003 año
803.992 bn
+42.191 bn
5.54%
1 ene 2004 año
882.229 bn
+78.237 bn
9.73%
1 ene 2005 año
988.205 bn
+105.976 bn
12.01%
1 ene 2006 año
1.015 billones
+27.178 bn
2.75%
1 ene 2007 año
1.084 billones
+68.809 bn
6.78%
1 ene 2008 año
1.17 billones
+86.07 bn
7.94%
1 ene 2009 año
1.205 billones
+34.382 bn
2.94%
1 ene 2010 año
1.014 billones
-190.219 bn
-15.79%
1 ene 2011 año
1.063 billones
+48.979 bn
4.83%
1 ene 2012 año
1.111 billones
+47.588 bn
4.48%
1 ene 2013 año
1.123 billones
+11.783 bn
1.06%
1 ene 2014 año
1.12 billones
-2.537 bn
-0.23%
1 ene 2015 año
1.053 billones
-67.483 bn
-6.02%
1 ene 2016 año
947.557 bn
-105.197 bn
-9.99%
Ranking de los países por los datos estadísticos actuales

Comentarios:

Enviar
PremiumAbout & FeedbackAcuerdoPrivacidad
logo
© 2022 Selected Technologies LLC – Morgan Hill, California