29
/es/
es
AIzaSyAYiBZKx7MnpbEhh9jyipgxe19OcubqV5w
April 1, 2024
183883
Macedonia, FYR
MKD
true
2
1
GNI (constant LCU)
2016,2015,2014,2013,2012,2011,2010,2009,2008,2007,2006,2005,2004,2003,2002,2001,2000,1999,1998,1997,1996,1995,1994,1993,1992,1991
Download
Estadísticas Globales de la Biblioteca →Macedonia, FYR →

GNI (constant LCU)

Estas estadísticas en otros países:
AlbaniaAlgeriaAngolaAntigua and BarbudaArgentinaArmeniaAustraliaAustriaAzerbaijanBahamas, TheBahrainBangladeshBarbadosBelarusBelgiumBelizeBeninBhutanBoliviaBosnia and HerzegovinaBotswanaBrazilBrunei DarussalamBulgariaBurkina FasoBurundiCabo VerdeCambodiaCameroonCanadaChadChileChinaColombiaComorosCongo, Dem. Rep.Congo, Rep.Costa RicaCote d'IvoireCroatiaCubaCyprusCzech RepublicDenmarkDjiboutiDominican RepublicEcuadorEgypt, Arab Rep.El SalvadorEquatorial GuineaEritreaEstoniaEthiopiaFijiFinlandFranceGabonGambia, TheGeorgiaGermanyGhanaGreeceGuatemalaGuineaGuinea-BissauHaitiHondurasHong Kong SAR, ChinaHungaryIcelandIndiaIndonesiaIran, Islamic Rep.IrelandIsraelItalyJamaicaJapanJordanKazakhstanKenyaKorea, Rep.KosovoKuwaitKyrgyz RepublicLao PDRLatviaLebanonLiberiaLibyaLithuaniaLuxembourgMacao SAR, ChinaMacedonia, FYRMadagascarMalawiMalaysiaMaliMaltaMauritaniaMauritiusMexicoMoldovaMongoliaMontenegroMoroccoMozambiqueMyanmarNamibiaNepalNetherlandsNew ZealandNicaraguaNigerNigeriaNorwayOmanPakistanPanamaPapua New GuineaParaguayPeruPhilippinesPolandPortugalPuerto RicoQatarRomaniaRussian FederationRwandaSamoaSaudi ArabiaSenegalSerbiaSeychellesSierra LeoneSingaporeSlovak RepublicSloveniaSomaliaSouth AfricaSouth SudanSpainSri LankaSudanSurinameSwazilandSwedenSwitzerlandSyrian Arab RepublicTajikistanTanzaniaThailandTimor-LesteTogoTrinidad and TobagoTunisiaTurkeyTurkmenistanUgandaUkraineUnited Arab EmiratesUnited KingdomUnited StatesUruguayUzbekistanVanuatuVenezuela, RBVietnamWest Bank and GazaZambiaZimbabwe
línea de tiempo (timeline):
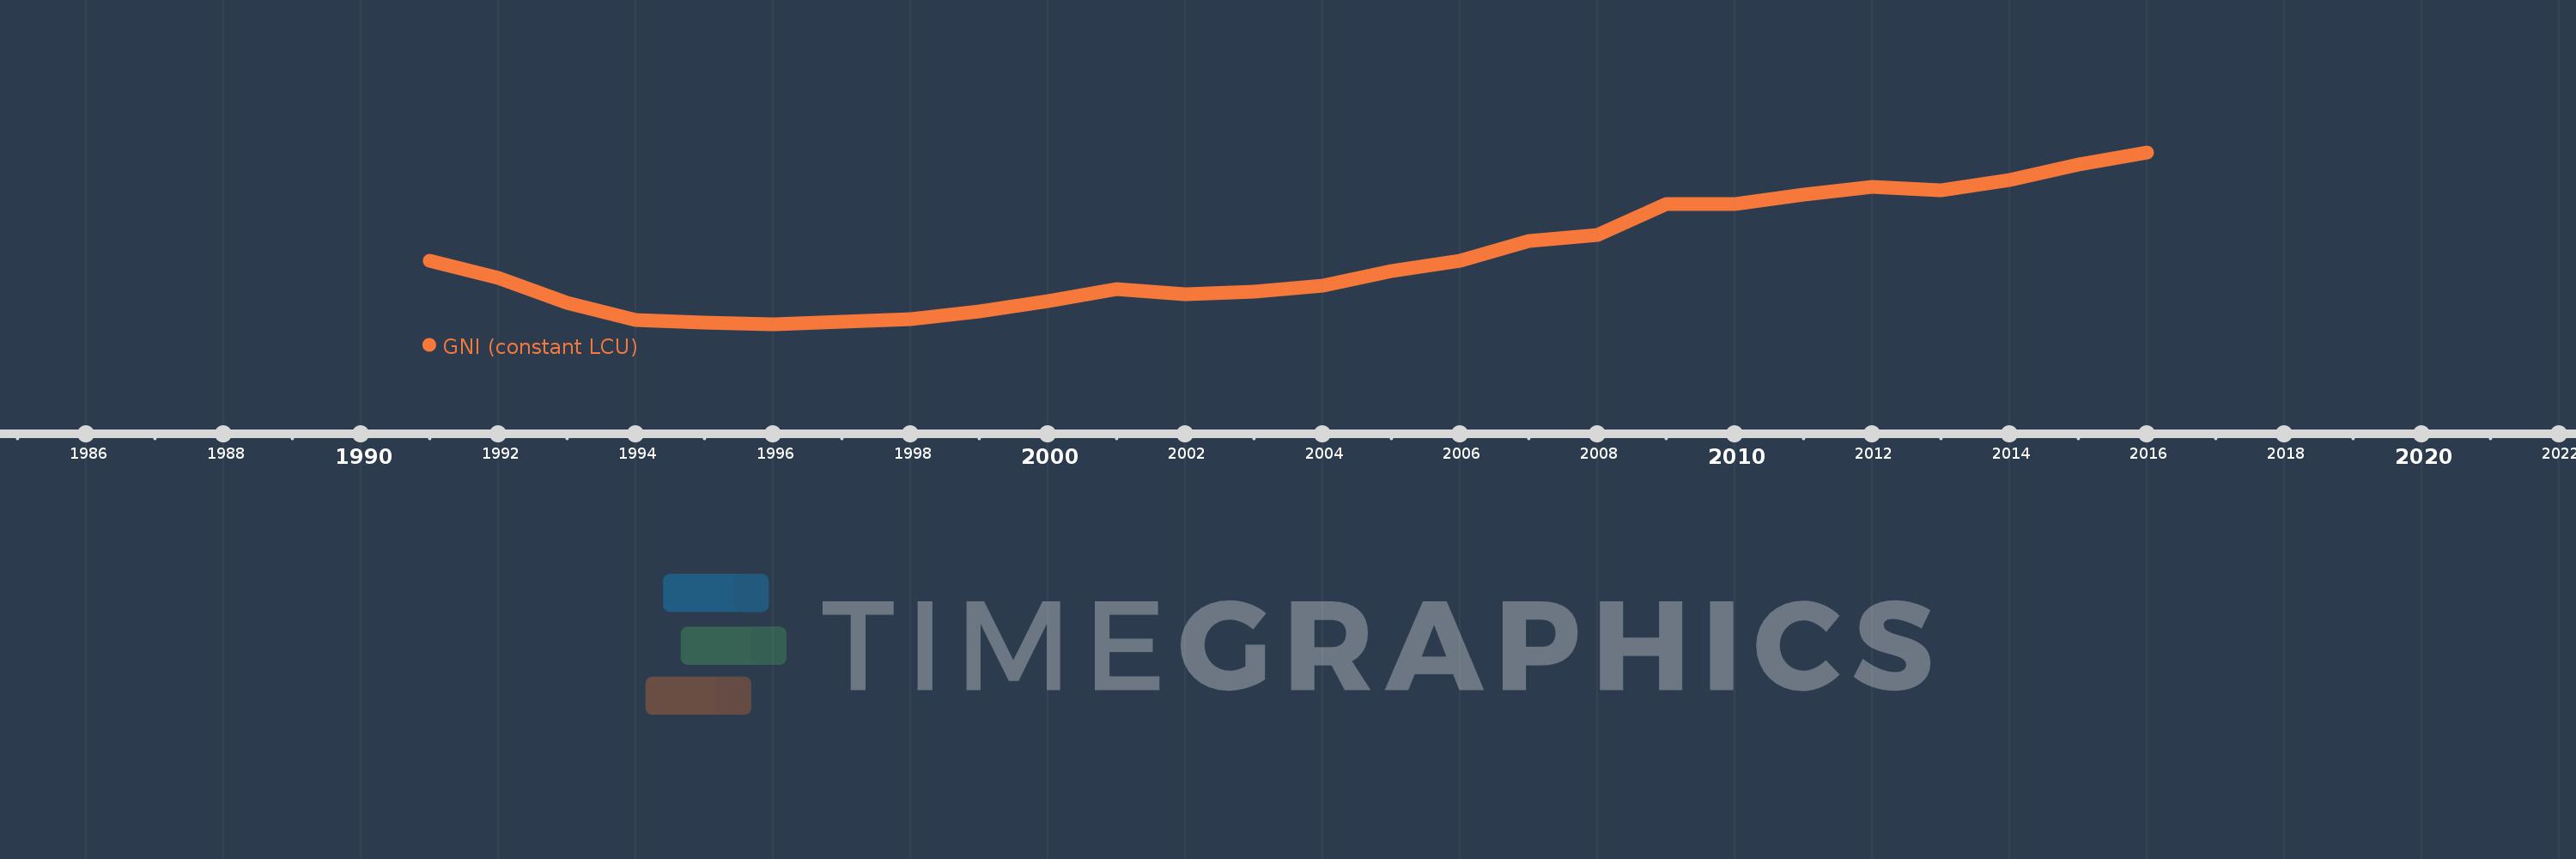
En esta escala de tiempo se presenta un gráfico de 1991 y 2016 de Macedonia, FYR. Los datos de 1990 están ausentes. El número de observaciones reales por fecha: 26.
Fuente (nombre):
Indicadores del desarrollo mundial
Fuente (organización):
World Bank national accounts data, and OECD National Accounts data files.
Categorías:
Economy & Growth
Se ha actualizado:
23 abr 2017 año
Los indicadores de los cambios de valor en los últimos años
En promedio:
305.964 bn
Mínimo:
239.609 bn
1 ene 1996 año
Máximo:
411.785 bn
1 ene 2016 año
A la fecha de observación
Valor
Cambio absoluto
El cambio con respecto al valor anterior
1 ene 1991 año
303.186 bn
+303.186 bn
0.0%
1 ene 1992 año
286.061 bn
-17.125 bn
-5.65%
1 ene 1993 año
260.697 bn
-25.364 bn
-8.87%
1 ene 1994 año
243.672 bn
-17.025 bn
-6.53%
1 ene 1995 año
241.26 bn
-2.412 bn
-0.99%
1 ene 1996 año
239.609 bn
-1.651 bn
-0.68%
1 ene 1997 año
241.799 bn
+2.19 bn
0.91%
1 ene 1998 año
244.621 bn
+2.822 bn
1.17%
1 ene 1999 año
252.823 bn
+8.202 bn
3.35%
1 ene 2000 año
262.485 bn
+9.661 bn
3.82%
1 ene 2001 año
274.708 bn
+12.224 bn
4.66%
1 ene 2002 año
269.228 bn
-5.48 bn
-1.99%
1 ene 2003 año
272.168 bn
+2.94 bn
1.09%
1 ene 2004 año
278.011 bn
+5.844 bn
2.15%
1 ene 2005 año
292.731 bn
+14.72 bn
5.29%
1 ene 2006 año
303.067 bn
+10.336 bn
3.53%
1 ene 2007 año
323.005 bn
+19.938 bn
6.58%
1 ene 2008 año
329.188 bn
+6.184 bn
1.91%
1 ene 2009 año
359.912 bn
+30.723 bn
9.33%
1 ene 2010 año
360.34 bn
+428.594 millones
0.12%
1 ene 2011 año
369.906 bn
+9.566 bn
2.65%
1 ene 2012 año
377.235 bn
+7.329 bn
1.98%
1 ene 2013 año
374.009 bn
-3.226 bn
-0.86%
1 ene 2014 año
384.046 bn
+10.038 bn
2.68%
1 ene 2015 año
399.502 bn
+15.456 bn
4.02%
1 ene 2016 año
411.785 bn
+12.283 bn
3.07%
Ranking de los países por los datos estadísticos actuales

Comentarios:

Enviar
PremiumAbout & FeedbackAcuerdoPrivacidad
logo
© 2022 Selected Technologies LLC – Morgan Hill, California