29
/es/
es
AIzaSyAYiBZKx7MnpbEhh9jyipgxe19OcubqV5w
April 1, 2024
228500
Romania
ROU
true
2
1
GNI (constant LCU)
2016,2015,2014,2013,2012,2011,2010,2009,2008,2007,2006,2005,2004,2003,2002,2001,2000,1999,1998,1997,1996,1995,1994,1993,1992,1991
Download
Estadísticas Globales de la Biblioteca →Romania →

GNI (constant LCU)

Estas estadísticas en otros países:
AlbaniaAlgeriaAngolaAntigua and BarbudaArgentinaArmeniaAustraliaAustriaAzerbaijanBahamas, TheBahrainBangladeshBarbadosBelarusBelgiumBelizeBeninBhutanBoliviaBosnia and HerzegovinaBotswanaBrazilBrunei DarussalamBulgariaBurkina FasoBurundiCabo VerdeCambodiaCameroonCanadaChadChileChinaColombiaComorosCongo, Dem. Rep.Congo, Rep.Costa RicaCote d'IvoireCroatiaCubaCyprusCzech RepublicDenmarkDjiboutiDominican RepublicEcuadorEgypt, Arab Rep.El SalvadorEquatorial GuineaEritreaEstoniaEthiopiaFijiFinlandFranceGabonGambia, TheGeorgiaGermanyGhanaGreeceGuatemalaGuineaGuinea-BissauHaitiHondurasHong Kong SAR, ChinaHungaryIcelandIndiaIndonesiaIran, Islamic Rep.IrelandIsraelItalyJamaicaJapanJordanKazakhstanKenyaKorea, Rep.KosovoKuwaitKyrgyz RepublicLao PDRLatviaLebanonLiberiaLibyaLithuaniaLuxembourgMacao SAR, ChinaMacedonia, FYRMadagascarMalawiMalaysiaMaliMaltaMauritaniaMauritiusMexicoMoldovaMongoliaMontenegroMoroccoMozambiqueMyanmarNamibiaNepalNetherlandsNew ZealandNicaraguaNigerNigeriaNorwayOmanPakistanPanamaPapua New GuineaParaguayPeruPhilippinesPolandPortugalPuerto RicoQatarRomaniaRussian FederationRwandaSamoaSaudi ArabiaSenegalSerbiaSeychellesSierra LeoneSingaporeSlovak RepublicSloveniaSomaliaSouth AfricaSouth SudanSpainSri LankaSudanSurinameSwazilandSwedenSwitzerlandSyrian Arab RepublicTajikistanTanzaniaThailandTimor-LesteTogoTrinidad and TobagoTunisiaTurkeyTurkmenistanUgandaUkraineUnited Arab EmiratesUnited KingdomUnited StatesUruguayUzbekistanVanuatuVenezuela, RBVietnamWest Bank and GazaZambiaZimbabwe
línea de tiempo (timeline):
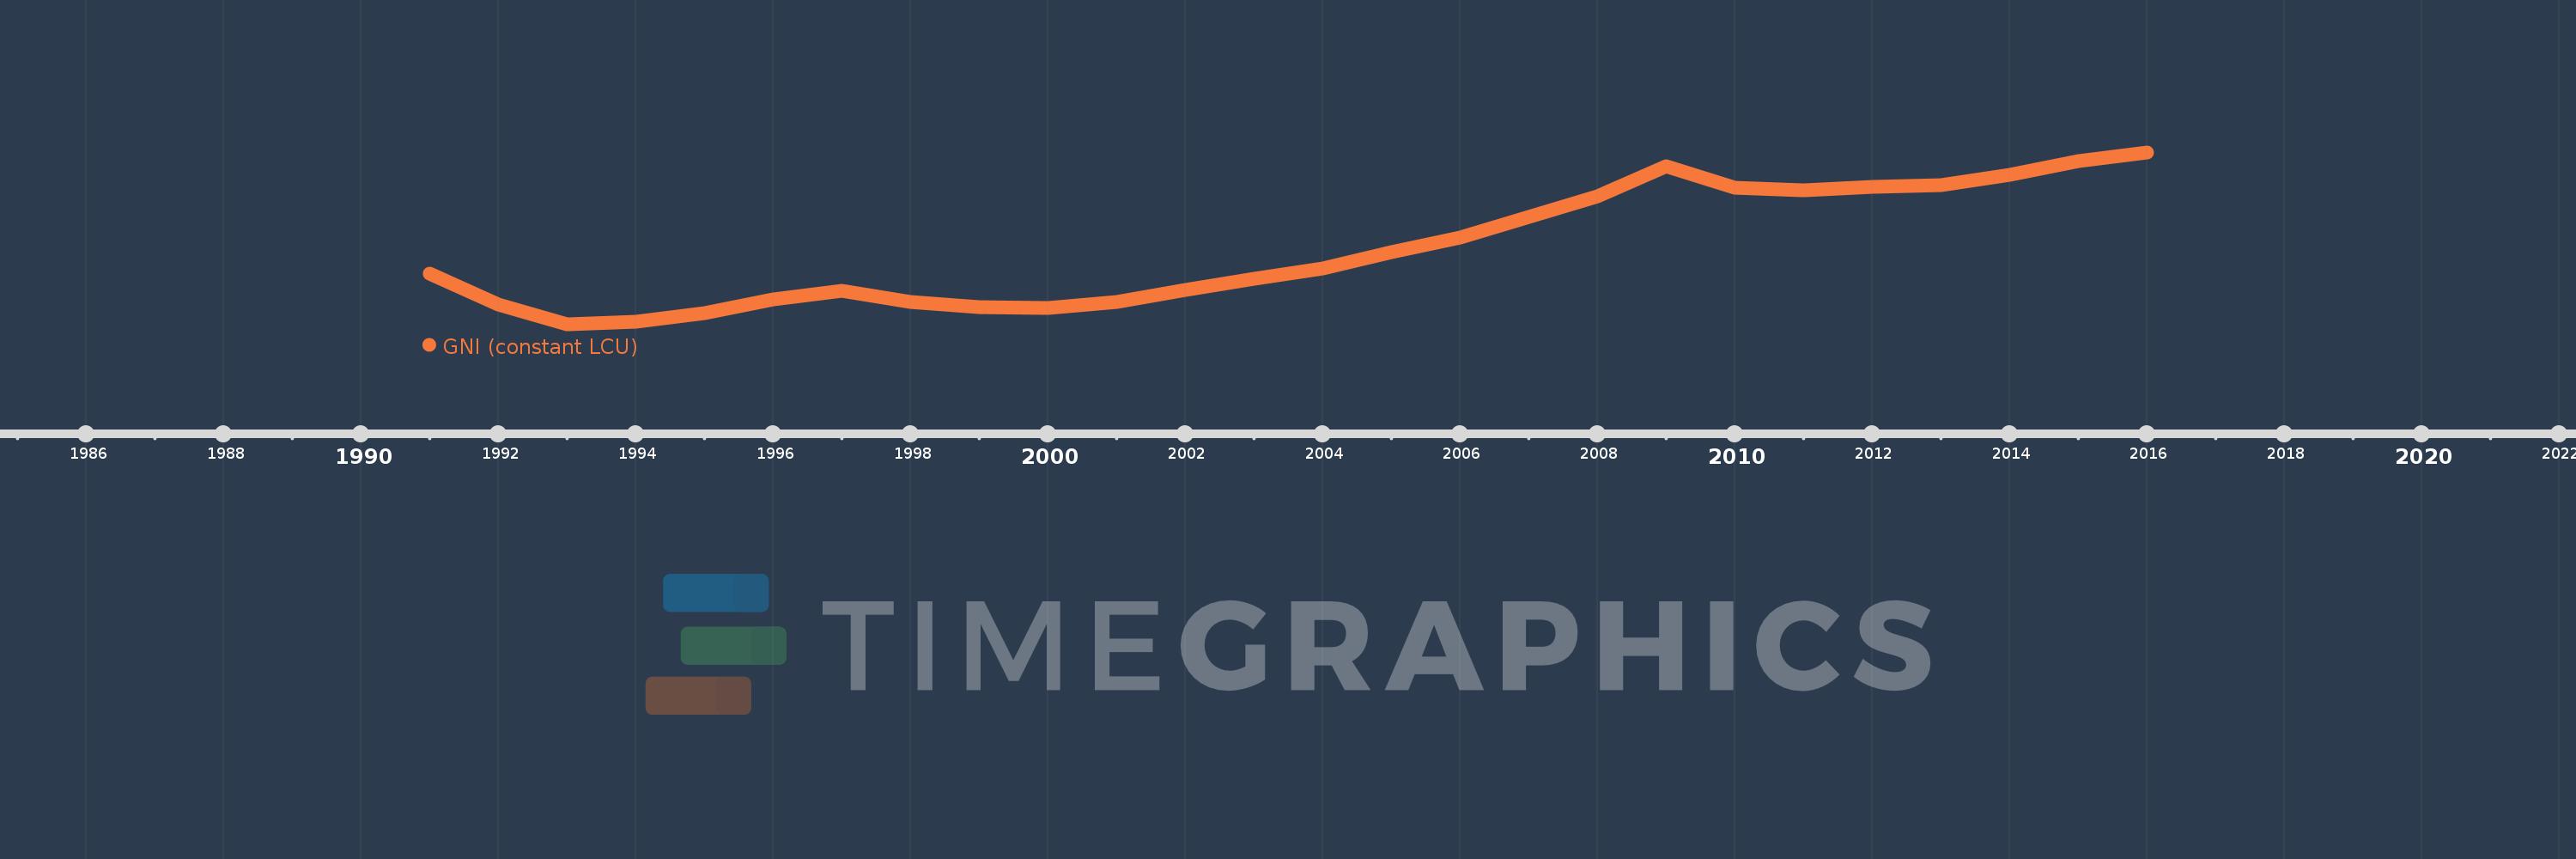
En esta escala de tiempo se presenta un gráfico de 1991 y 2016 de Romania. Los datos de 1990 están ausentes. El número de observaciones reales por fecha: 26.
Fuente (nombre):
Indicadores del desarrollo mundial
Fuente (organización):
World Bank national accounts data, and OECD National Accounts data files.
Categorías:
Economy & Growth
Se ha actualizado:
23 abr 2017 año
Los indicadores de los cambios de valor en los últimos años
En promedio:
270.338 bn
Mínimo:
196.065 bn
1 ene 1993 año
Máximo:
367.225 bn
1 ene 2016 año
A la fecha de observación
Valor
Cambio absoluto
El cambio con respecto al valor anterior
1 ene 1991 año
246.768 bn
+246.768 bn
0.0%
1 ene 1992 año
215.747 bn
-31.02 bn
-12.57%
1 ene 1993 año
196.065 bn
-19.682 bn
-9.12%
1 ene 1994 año
198.674 bn
+2.609 bn
1.33%
1 ene 1995 año
206.722 bn
+8.048 bn
4.05%
1 ene 1996 año
221.059 bn
+14.337 bn
6.94%
1 ene 1997 año
229.239 bn
+8.18 bn
3.7%
1 ene 1998 año
218.037 bn
-11.201 bn
-4.89%
1 ene 1999 año
212.873 bn
-5.165 bn
-2.37%
1 ene 2000 año
211.957 bn
-915.9 millones
-0.43%
1 ene 2001 año
218.099 bn
+6.142 bn
2.9%
1 ene 2002 año
230.478 bn
+12.379 bn
5.68%
1 ene 2003 año
241.523 bn
+11.045 bn
4.79%
1 ene 2004 año
251.719 bn
+10.196 bn
4.22%
1 ene 2005 año
267.567 bn
+15.848 bn
6.3%
1 ene 2006 año
282.061 bn
+14.494 bn
5.42%
1 ene 2007 año
303.239 bn
+21.178 bn
7.51%
1 ene 2008 año
323.365 bn
+20.125 bn
6.64%
1 ene 2009 año
353.502 bn
+30.138 bn
9.32%
1 ene 2010 año
332.306 bn
-21.196 bn
-6.0%
1 ene 2011 año
329.832 bn
-2.475 bn
-0.74%
1 ene 2012 año
332.69 bn
+2.859 bn
0.87%
1 ene 2013 año
334.608 bn
+1.917 bn
0.58%
1 ene 2014 año
344.638 bn
+10.03 bn
3.0%
1 ene 2015 año
358.804 bn
+14.166 bn
4.11%
1 ene 2016 año
367.225 bn
+8.421 bn
2.35%
Ranking de los países por los datos estadísticos actuales

Comentarios:

Enviar
PremiumAbout & FeedbackAcuerdoPrivacidad
logo
© 2022 Selected Technologies LLC – Morgan Hill, California