29
/es/
es
AIzaSyAYiBZKx7MnpbEhh9jyipgxe19OcubqV5w
April 1, 2024
269347
Turkey
TUR
true
2
1
GNI (constant LCU)
2016,2015,2014,2013,2012,2011,2010,2009,2008,2007,2006,2005,2004,2003,2002,2001,2000,1999,1998,1997,1996,1995,1994,1993,1992,1991,1990,1989,1988
Download
Estadísticas Globales de la Biblioteca →Turkey →

GNI (constant LCU)

Estas estadísticas en otros países:
AlbaniaAlgeriaAngolaAntigua and BarbudaArgentinaArmeniaAustraliaAustriaAzerbaijanBahamas, TheBahrainBangladeshBarbadosBelarusBelgiumBelizeBeninBhutanBoliviaBosnia and HerzegovinaBotswanaBrazilBrunei DarussalamBulgariaBurkina FasoBurundiCabo VerdeCambodiaCameroonCanadaChadChileChinaColombiaComorosCongo, Dem. Rep.Congo, Rep.Costa RicaCote d'IvoireCroatiaCubaCyprusCzech RepublicDenmarkDjiboutiDominican RepublicEcuadorEgypt, Arab Rep.El SalvadorEquatorial GuineaEritreaEstoniaEthiopiaFijiFinlandFranceGabonGambia, TheGeorgiaGermanyGhanaGreeceGuatemalaGuineaGuinea-BissauHaitiHondurasHong Kong SAR, ChinaHungaryIcelandIndiaIndonesiaIran, Islamic Rep.IrelandIsraelItalyJamaicaJapanJordanKazakhstanKenyaKorea, Rep.KosovoKuwaitKyrgyz RepublicLao PDRLatviaLebanonLiberiaLibyaLithuaniaLuxembourgMacao SAR, ChinaMacedonia, FYRMadagascarMalawiMalaysiaMaliMaltaMauritaniaMauritiusMexicoMoldovaMongoliaMontenegroMoroccoMozambiqueMyanmarNamibiaNepalNetherlandsNew ZealandNicaraguaNigerNigeriaNorwayOmanPakistanPanamaPapua New GuineaParaguayPeruPhilippinesPolandPortugalPuerto RicoQatarRomaniaRussian FederationRwandaSamoaSaudi ArabiaSenegalSerbiaSeychellesSierra LeoneSingaporeSlovak RepublicSloveniaSomaliaSouth AfricaSouth SudanSpainSri LankaSudanSurinameSwazilandSwedenSwitzerlandSyrian Arab RepublicTajikistanTanzaniaThailandTimor-LesteTogoTrinidad and TobagoTunisiaTurkeyTurkmenistanUgandaUkraineUnited Arab EmiratesUnited KingdomUnited StatesUruguayUzbekistanVanuatuVenezuela, RBVietnamWest Bank and GazaZambiaZimbabwe
línea de tiempo (timeline):
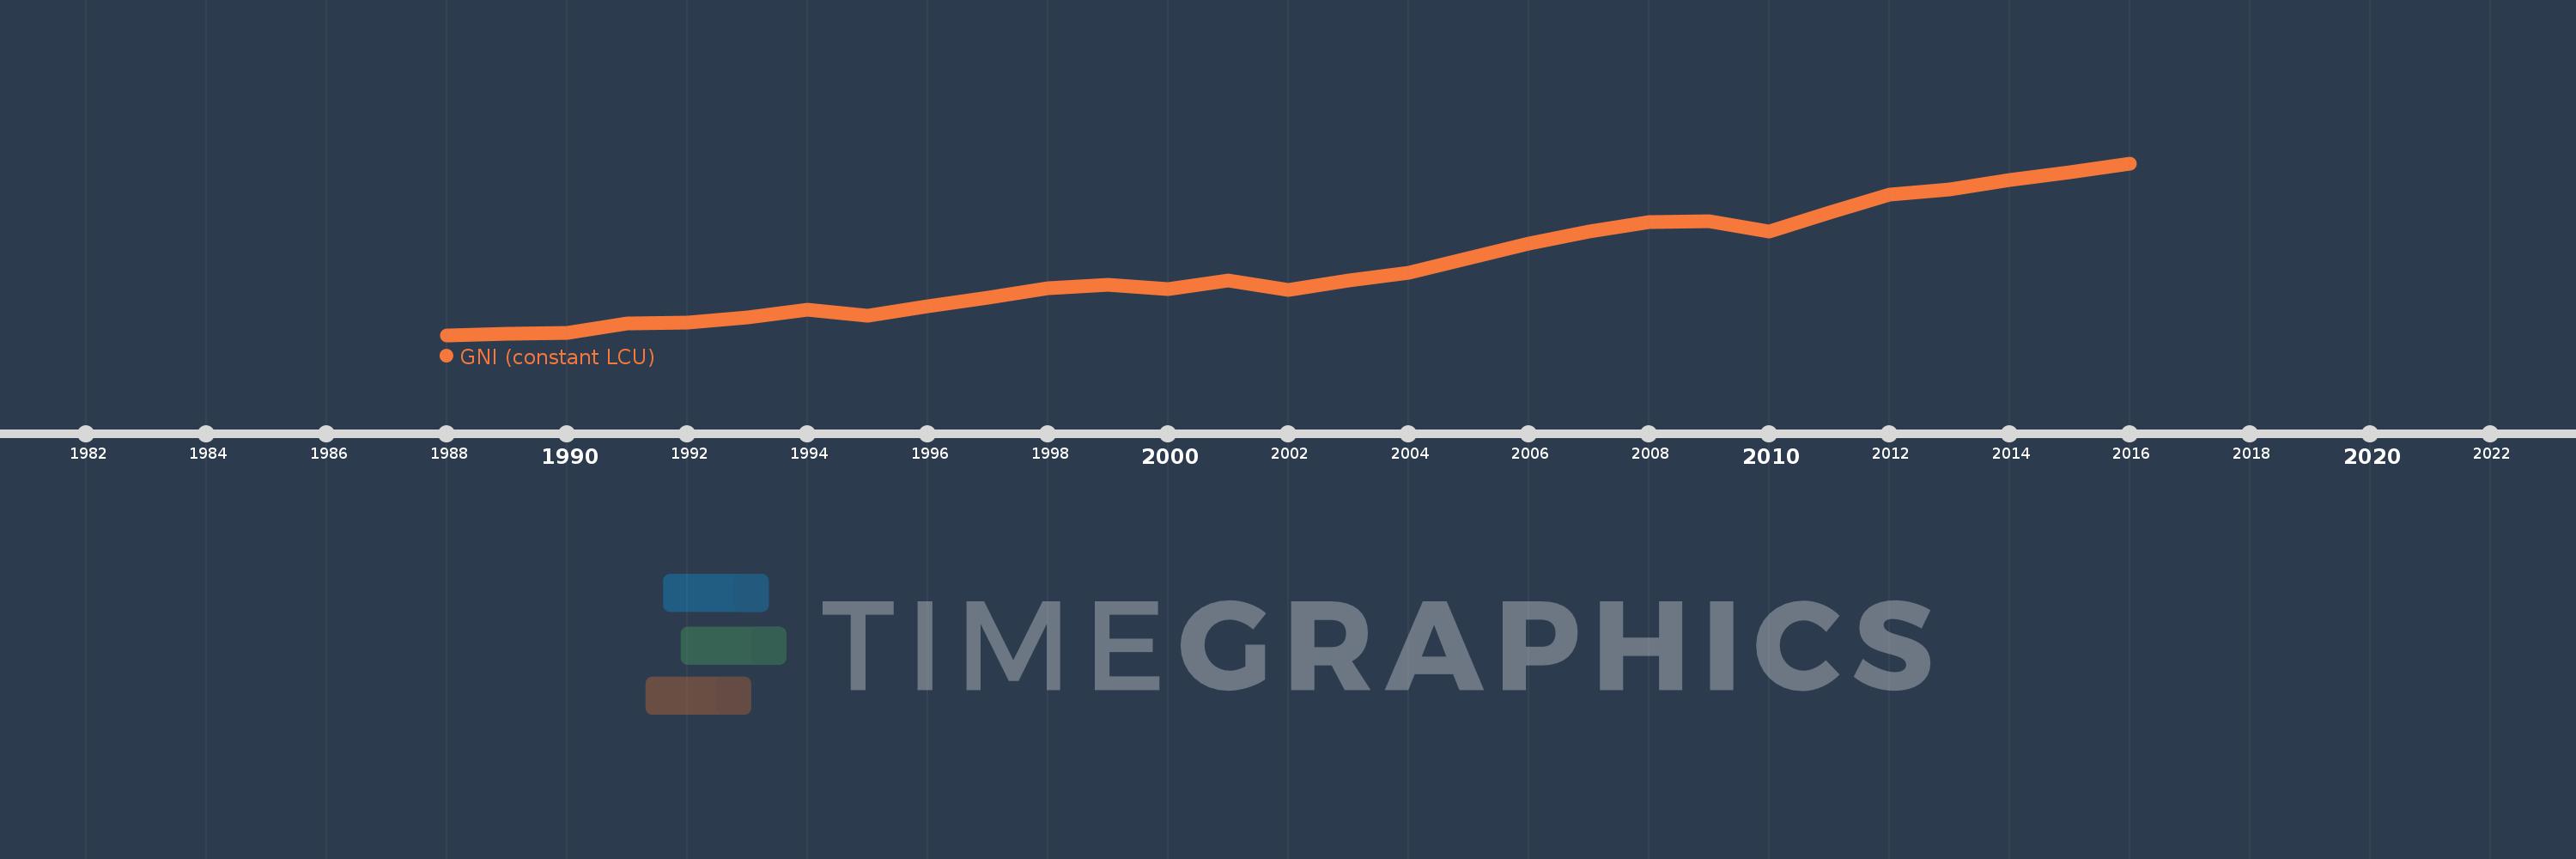
En esta escala de tiempo se presenta un gráfico de 1988 y 2016 de Turkey. Los datos de 1987 están ausentes. El número de observaciones reales por fecha: 29.
Fuente (nombre):
Indicadores del desarrollo mundial
Fuente (organización):
World Bank national accounts data, and OECD National Accounts data files.
Categorías:
Economy & Growth
Se ha actualizado:
23 abr 2017 año
Los indicadores de los cambios de valor en los últimos años
En promedio:
78.731 bn
Mínimo:
44.177 bn
1 ene 1988 año
Máximo:
129.559 bn
1 ene 2016 año
A la fecha de observación
Valor
Cambio absoluto
El cambio con respecto al valor anterior
1 ene 1988 año
44.177 bn
+44.177 bn
0.0%
1 ene 1989 año
45.023 bn
+846.208 millones
1.92%
1 ene 1990 año
45.444 bn
+420.912 millones
0.93%
1 ene 1991 año
49.9 bn
+4.455 bn
9.8%
1 ene 1992 año
50.207 bn
+307.735 millones
0.62%
1 ene 1993 año
52.796 bn
+2.589 bn
5.16%
1 ene 1994 año
56.902 bn
+4.106 bn
7.78%
1 ene 1995 año
53.708 bn
-3.195 bn
-5.61%
1 ene 1996 año
58.324 bn
+4.616 bn
8.59%
1 ene 1997 año
62.817 bn
+4.493 bn
7.7%
1 ene 1998 año
67.583 bn
+4.766 bn
7.59%
1 ene 1999 año
69.33 bn
+1.747 bn
2.59%
1 ene 2000 año
66.875 bn
-2.456 bn
-3.54%
1 ene 2001 año
71.365 bn
+4.49 bn
6.71%
1 ene 2002 año
66.588 bn
-4.776 bn
-6.69%
1 ene 2003 año
71.119 bn
+4.53 bn
6.8%
1 ene 2004 año
74.948 bn
+3.83 bn
5.39%
1 ene 2005 año
82.293 bn
+7.345 bn
9.8%
1 ene 2006 año
89.493 bn
+7.2 bn
8.75%
1 ene 2007 año
95.662 bn
+6.168 bn
6.89%
1 ene 2008 año
100.278 bn
+4.616 bn
4.83%
1 ene 2009 año
100.879 bn
+601.087 millones
0.6%
1 ene 2010 año
95.809 bn
-5.07 bn
-5.03%
1 ene 2011 año
104.957 bn
+9.148 bn
9.55%
1 ene 2012 año
114.137 bn
+9.181 bn
8.75%
1 ene 2013 año
116.685 bn
+2.548 bn
2.23%
1 ene 2014 año
121.322 bn
+4.636 bn
3.97%
1 ene 2015 año
125.013 bn
+3.691 bn
3.04%
1 ene 2016 año
129.559 bn
+4.546 bn
3.64%
Ranking de los países por los datos estadísticos actuales

Comentarios:

Enviar
PremiumAbout & FeedbackAcuerdoPrivacidad
logo
© 2022 Selected Technologies LLC – Morgan Hill, California