29
/es/
es
AIzaSyAYiBZKx7MnpbEhh9jyipgxe19OcubqV5w
April 1, 2024
258454
Syrian Arab Republic
SYR
true
2
1
Industry, value added (current LCU)
2008,2007,2006,2005,2004,2003,2002,2001,2000,1999,1998,1997,1996,1995,1994,1993,1992,1991,1990,1989,1988,1987,1986
Download
Estadísticas Globales de la Biblioteca →Syrian Arab Republic →

Industry, value added (current LCU)

Estas estadísticas en otros países:
AfghanistanAlbaniaAlgeriaAndorraAngolaAntigua and BarbudaArgentinaArmeniaArubaAustraliaAustriaAzerbaijanBahamas, TheBahrainBangladeshBarbadosBelarusBelgiumBelizeBeninBermudaBhutanBoliviaBosnia and HerzegovinaBotswanaBrazilBrunei DarussalamBulgariaBurkina FasoBurundiCabo VerdeCambodiaCameroonCanadaCayman IslandsCentral African RepublicChadChileChinaColombiaComorosCongo, Dem. Rep.Congo, Rep.Costa RicaCote d'IvoireCroatiaCubaCyprusCzech RepublicDenmarkDjiboutiDominicaDominican RepublicEcuadorEgypt, Arab Rep.El SalvadorEquatorial GuineaEritreaEstoniaEthiopiaFijiFinlandFranceGabonGambia, TheGeorgiaGermanyGhanaGreeceGrenadaGuatemalaGuineaGuinea-BissauGuyanaHondurasHong Kong SAR, ChinaHungaryIcelandIndiaIndonesiaIran, Islamic Rep.IraqIrelandItalyJamaicaJapanJordanKazakhstanKenyaKiribatiKorea, Rep.KosovoKuwaitKyrgyz RepublicLao PDRLatviaLebanonLesothoLiberiaLibyaLiechtensteinLithuaniaLuxembourgMacao SAR, ChinaMacedonia, FYRMadagascarMalawiMalaysiaMaldivesMaliMaltaMarshall IslandsMauritaniaMauritiusMexicoMicronesia, Fed. Sts.MoldovaMongoliaMontenegroMoroccoMozambiqueMyanmarNamibiaNepalNetherlandsNew CaledoniaNew ZealandNicaraguaNigerNigeriaNorwayOmanPakistanPalauPanamaPapua New GuineaParaguayPeruPhilippinesPolandPortugalPuerto RicoQatarRomaniaRussian FederationRwandaSamoaSao Tome and PrincipeSaudi ArabiaSenegalSerbiaSeychellesSierra LeoneSingaporeSlovak RepublicSloveniaSolomon IslandsSomaliaSouth AfricaSpainSri LankaSt. Kitts and NevisSt. LuciaSt. Vincent and the GrenadinesSudanSurinameSwazilandSwedenSwitzerlandSyrian Arab RepublicTajikistanTanzaniaThailandTimor-LesteTogoTongaTrinidad and TobagoTunisiaTurkeyTurkmenistanTuvaluUgandaUkraineUnited Arab EmiratesUnited KingdomUnited StatesUruguayUzbekistanVanuatuVenezuela, RBVietnamWest Bank and GazaYemen, Rep.ZambiaZimbabwe
línea de tiempo (timeline):
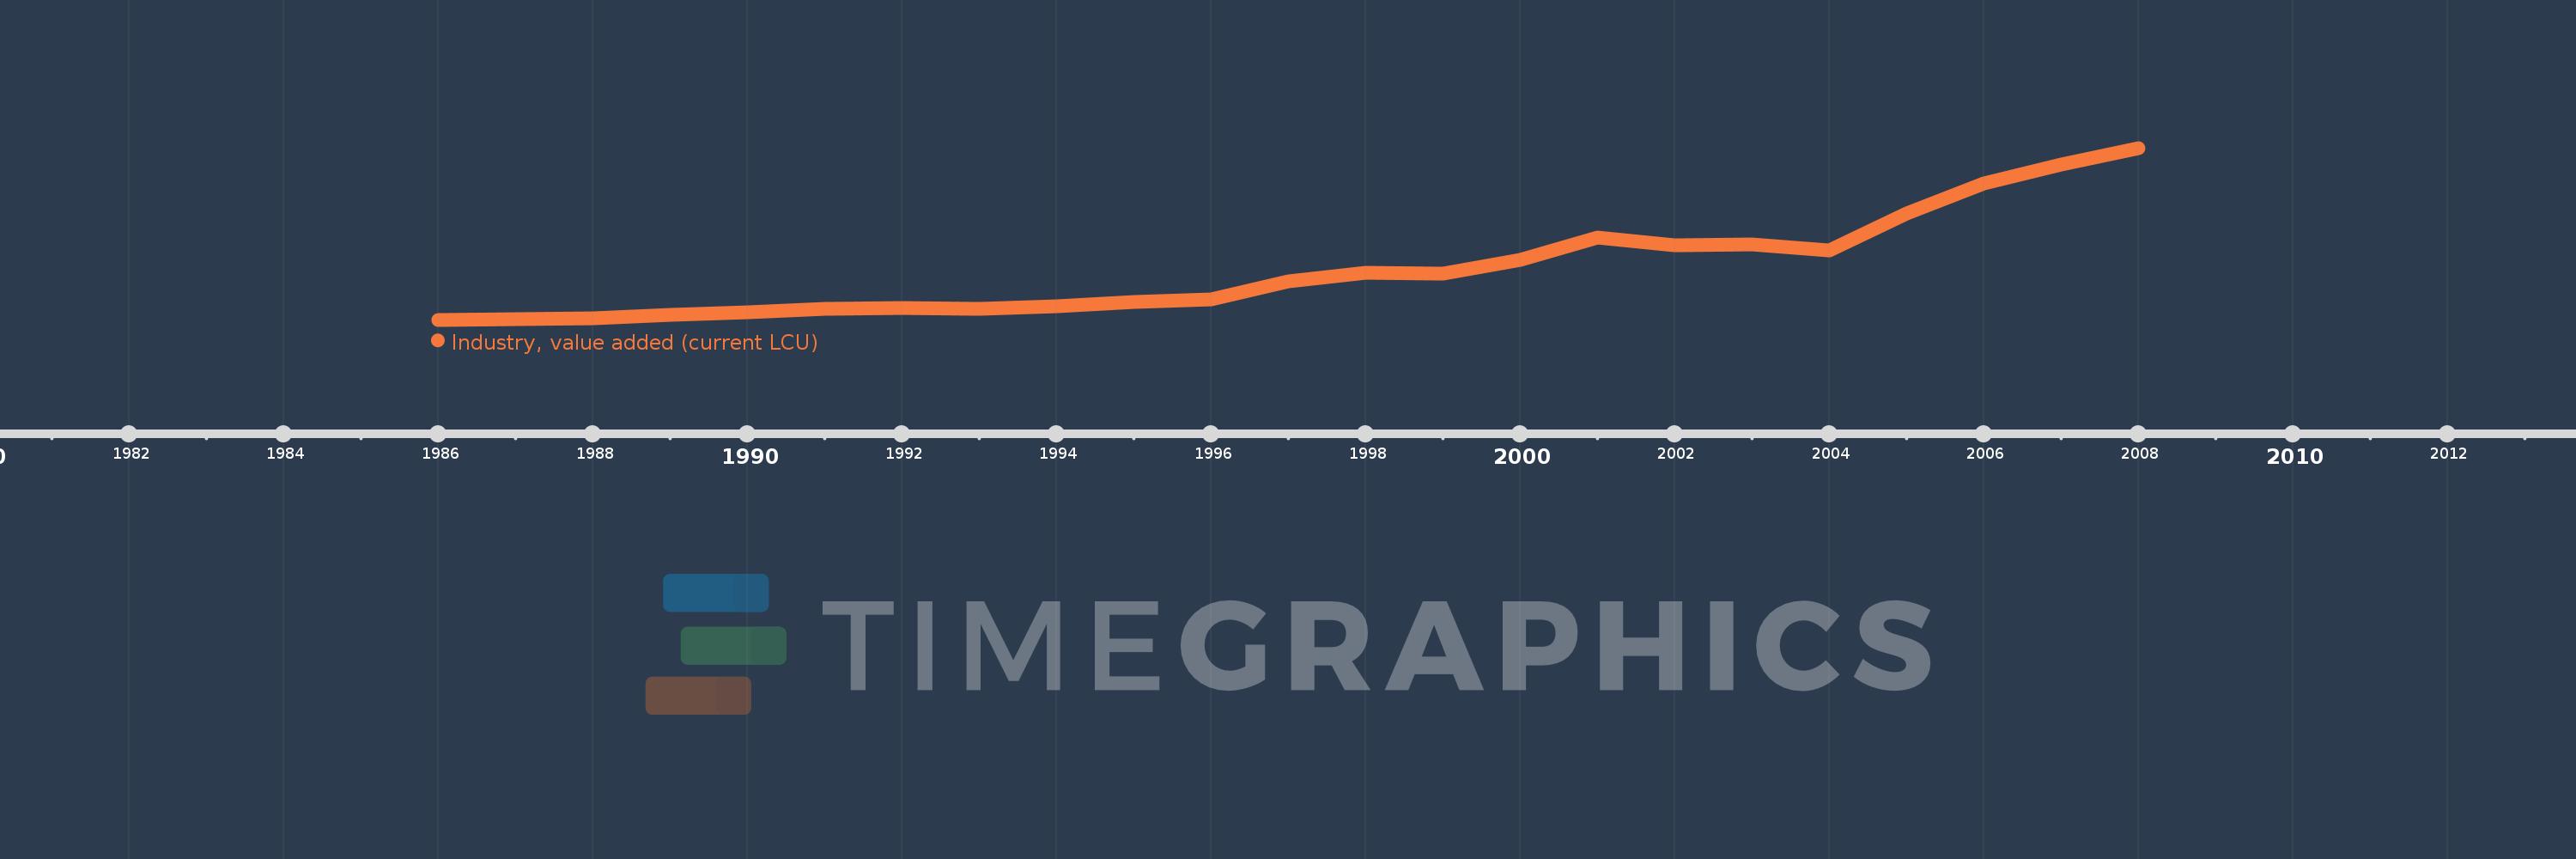
En esta escala de tiempo se presenta un gráfico de 1986 y 2008 de Syrian Arab Republic. Los datos de 1985 están ausentes. El número de observaciones reales por fecha: 23.
Fuente (nombre):
Indicadores del desarrollo mundial
Fuente (organización):
World Bank national accounts data, and OECD National Accounts data files.
Categorías:
Economy & Growth
Se ha actualizado:
23 abr 2017 año
Los indicadores de los cambios de valor en los últimos años
En promedio:
226.478 bn
Mínimo:
18.388 bn
1 ene 1986 año
Máximo:
724.637 bn
1 ene 2008 año
A la fecha de observación
Valor
Cambio absoluto
El cambio con respecto al valor anterior
1 ene 1986 año
18.388 bn
+18.388 bn
0.0%
1 ene 1987 año
22.46 bn
+4.072 bn
22.14%
1 ene 1988 año
25.024 bn
+2.564 bn
11.42%
1 ene 1989 año
37.765 bn
+12.74 bn
50.91%
1 ene 1990 año
50.029 bn
+12.265 bn
32.48%
1 ene 1991 año
64.802 bn
+14.773 bn
29.53%
1 ene 1992 año
67.828 bn
+3.026 bn
4.67%
1 ene 1993 año
64.49 bn
-3.338 bn
-4.92%
1 ene 1994 año
74.892 bn
+10.402 bn
16.13%
1 ene 1995 año
90.773 bn
+15.881 bn
21.21%
1 ene 1996 año
103.382 bn
+12.609 bn
13.89%
1 ene 1997 año
176.486 bn
+73.104 bn
70.71%
1 ene 1998 año
213.04 bn
+36.554 bn
20.71%
1 ene 1999 año
209.157 bn
-3.883 bn
-1.82%
1 ene 2000 año
264.087 bn
+54.93 bn
26.26%
1 ene 2001 año
356.084 bn
+91.997 bn
34.84%
1 ene 2002 año
322.956 bn
-33.128 bn
-9.3%
1 ene 2003 año
327.246 bn
+4.29 bn
1.33%
1 ene 2004 año
302.817 bn
-24.429 bn
-7.47%
1 ene 2005 año
455.731 bn
+152.914 bn
50.5%
1 ene 2006 año
580.022 bn
+124.291 bn
27.27%
1 ene 2007 año
656.897 bn
+76.875 bn
13.25%
1 ene 2008 año
724.637 bn
+67.74 bn
10.31%
Ranking de los países por los datos estadísticos actuales

Comentarios:

Enviar
PremiumAbout & FeedbackAcuerdoPrivacidad
logo
© 2022 Selected Technologies LLC – Morgan Hill, California