29
/es/
es
AIzaSyAYiBZKx7MnpbEhh9jyipgxe19OcubqV5w
April 1, 2024
118043
Czech Republic
CZE
true
2
1
Industry, value added (current LCU)
2016,2015,2014,2013,2012,2011,2010,2009,2008,2007,2006,2005,2004,2003,2002,2001,2000,1999,1998,1997,1996,1995,1994
Download
Estadísticas Globales de la Biblioteca →Czech Republic →

Industry, value added (current LCU)

Estas estadísticas en otros países:
AfghanistanAlbaniaAlgeriaAndorraAngolaAntigua and BarbudaArgentinaArmeniaArubaAustraliaAustriaAzerbaijanBahamas, TheBahrainBangladeshBarbadosBelarusBelgiumBelizeBeninBermudaBhutanBoliviaBosnia and HerzegovinaBotswanaBrazilBrunei DarussalamBulgariaBurkina FasoBurundiCabo VerdeCambodiaCameroonCanadaCayman IslandsCentral African RepublicChadChileChinaColombiaComorosCongo, Dem. Rep.Congo, Rep.Costa RicaCote d'IvoireCroatiaCubaCyprusCzech RepublicDenmarkDjiboutiDominicaDominican RepublicEcuadorEgypt, Arab Rep.El SalvadorEquatorial GuineaEritreaEstoniaEthiopiaFijiFinlandFranceGabonGambia, TheGeorgiaGermanyGhanaGreeceGrenadaGuatemalaGuineaGuinea-BissauGuyanaHondurasHong Kong SAR, ChinaHungaryIcelandIndiaIndonesiaIran, Islamic Rep.IraqIrelandItalyJamaicaJapanJordanKazakhstanKenyaKiribatiKorea, Rep.KosovoKuwaitKyrgyz RepublicLao PDRLatviaLebanonLesothoLiberiaLibyaLiechtensteinLithuaniaLuxembourgMacao SAR, ChinaMacedonia, FYRMadagascarMalawiMalaysiaMaldivesMaliMaltaMarshall IslandsMauritaniaMauritiusMexicoMicronesia, Fed. Sts.MoldovaMongoliaMontenegroMoroccoMozambiqueMyanmarNamibiaNepalNetherlandsNew CaledoniaNew ZealandNicaraguaNigerNigeriaNorwayOmanPakistanPalauPanamaPapua New GuineaParaguayPeruPhilippinesPolandPortugalPuerto RicoQatarRomaniaRussian FederationRwandaSamoaSao Tome and PrincipeSaudi ArabiaSenegalSerbiaSeychellesSierra LeoneSingaporeSlovak RepublicSloveniaSolomon IslandsSomaliaSouth AfricaSpainSri LankaSt. Kitts and NevisSt. LuciaSt. Vincent and the GrenadinesSudanSurinameSwazilandSwedenSwitzerlandSyrian Arab RepublicTajikistanTanzaniaThailandTimor-LesteTogoTongaTrinidad and TobagoTunisiaTurkeyTurkmenistanTuvaluUgandaUkraineUnited Arab EmiratesUnited KingdomUnited StatesUruguayUzbekistanVanuatuVenezuela, RBVietnamWest Bank and GazaYemen, Rep.ZambiaZimbabwe
línea de tiempo (timeline):
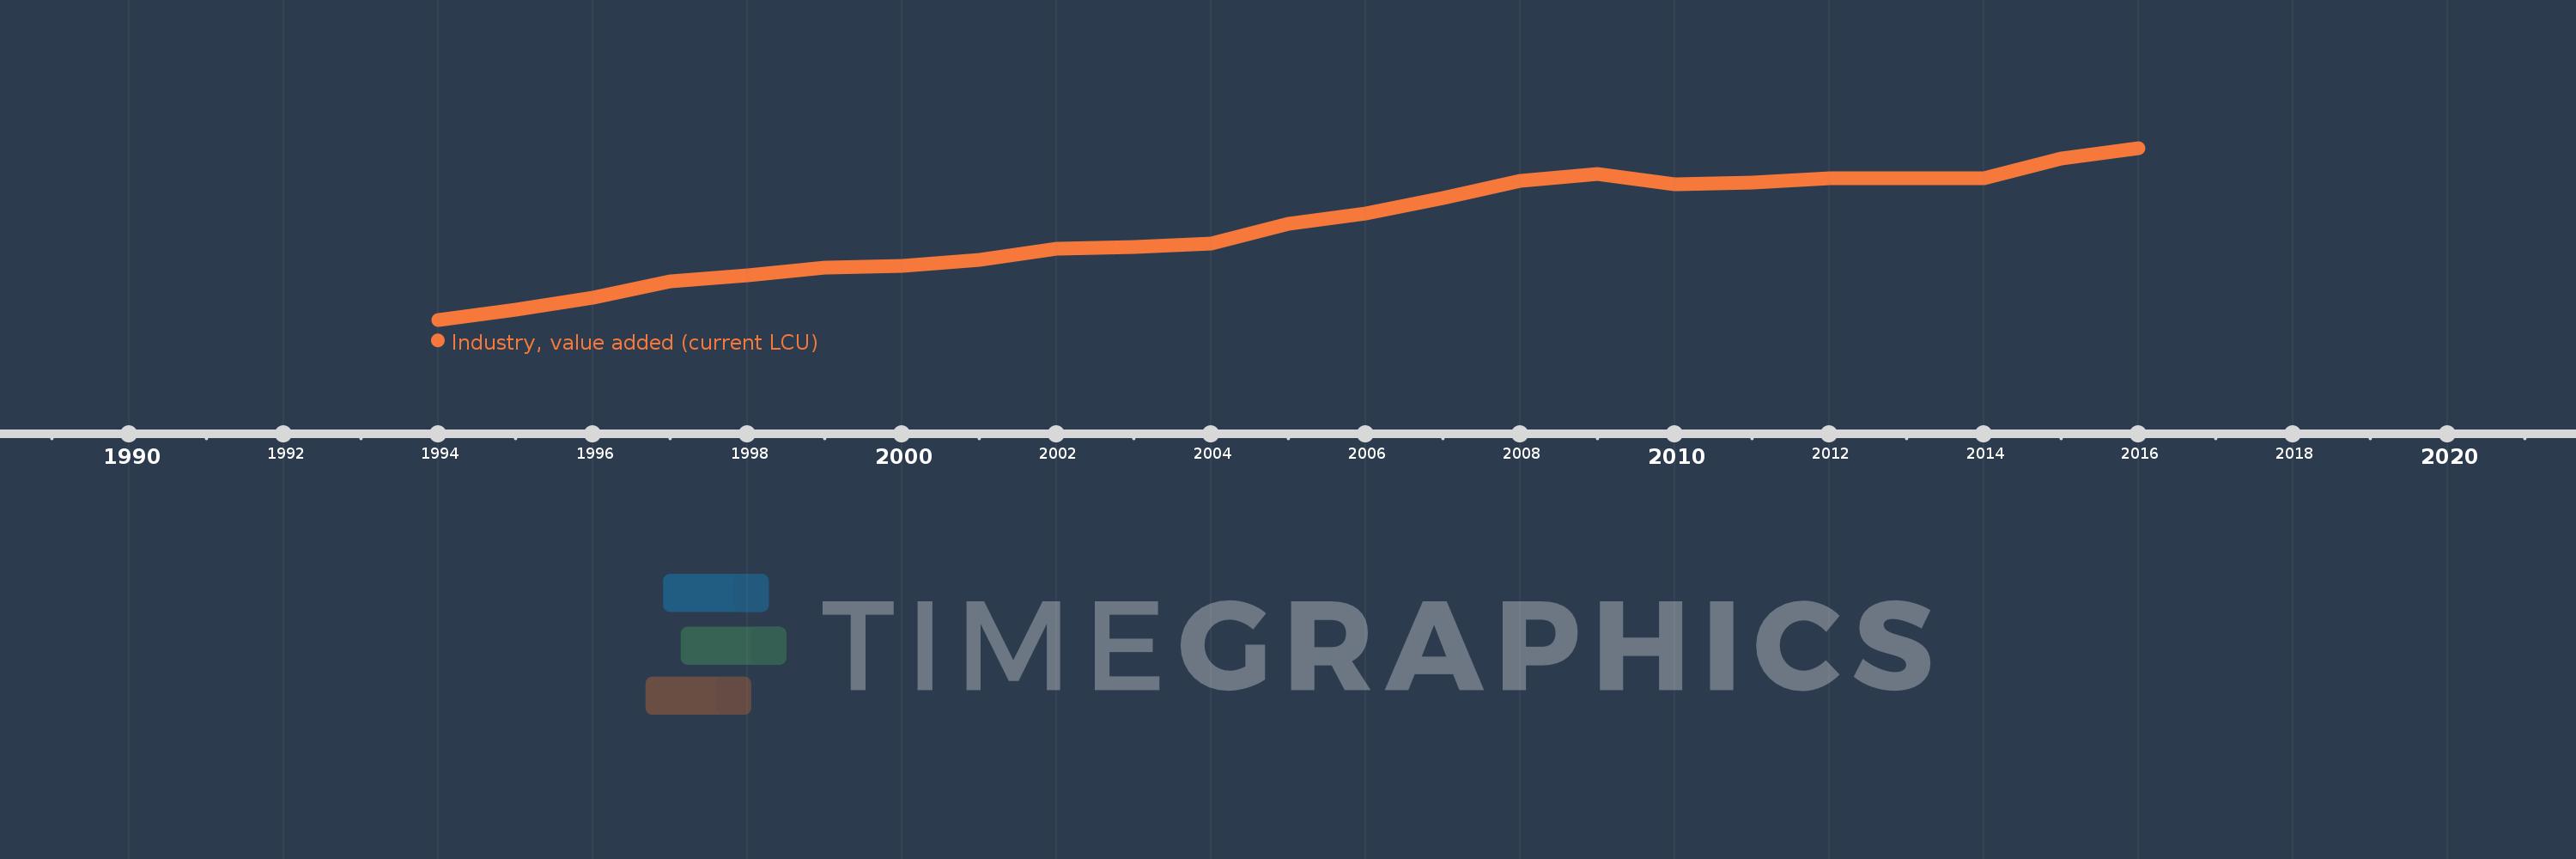
En esta escala de tiempo se presenta un gráfico de 1994 y 2016 de Czech Republic. Los datos de 1993 están ausentes. El número de observaciones reales por fecha: 23.
Fuente (nombre):
Indicadores del desarrollo mundial
Fuente (organización):
World Bank national accounts data, and OECD National Accounts data files.
Categorías:
Economy & Growth
Se ha actualizado:
23 abr 2017 año
Los indicadores de los cambios de valor en los últimos años
En promedio:
1.026 billones
Mínimo:
412.599 bn
1 ene 1994 año
Máximo:
1.547 billones
1 ene 2016 año
A la fecha de observación
Valor
Cambio absoluto
El cambio con respecto al valor anterior
1 ene 1994 año
412.599 bn
+412.599 bn
0.0%
1 ene 1995 año
476.322 bn
+63.723 bn
15.44%
1 ene 1996 año
560.943 bn
+84.621 bn
17.77%
1 ene 1997 año
667.952 bn
+107.009 bn
19.08%
1 ene 1998 año
708.461 bn
+40.509 bn
6.06%
1 ene 1999 año
754.641 bn
+46.18 bn
6.52%
1 ene 2000 año
765.603 bn
+10.962 bn
1.45%
1 ene 2001 año
806.052 bn
+40.449 bn
5.28%
1 ene 2002 año
880.195 bn
+74.143 bn
9.2%
1 ene 2003 año
891.74 bn
+11.545 bn
1.31%
1 ene 2004 año
916.763 bn
+25.023 bn
2.81%
1 ene 2005 año
1.043 billones
+126.529 bn
13.8%
1 ene 2006 año
1.112 billones
+68.989 bn
6.61%
1 ene 2007 año
1.218 billones
+105.918 bn
9.52%
1 ene 2008 año
1.328 billones
+109.943 bn
9.03%
1 ene 2009 año
1.375 billones
+46.582 bn
3.51%
1 ene 2010 año
1.307 billones
-68.182 bn
-4.96%
1 ene 2011 año
1.318 billones
+11.319 bn
0.87%
1 ene 2012 año
1.348 billones
+29.745 bn
2.26%
1 ene 2013 año
1.346 billones
-1.18 bn
-0.09%
1 ene 2014 año
1.346 billones
-174.0 millones
-0.01%
1 ene 2015 año
1.477 billones
+131.042 bn
9.73%
1 ene 2016 año
1.547 billones
+69.554 bn
4.71%
Ranking de los países por los datos estadísticos actuales

Comentarios:

Enviar
PremiumAbout & FeedbackAcuerdoPrivacidad
logo
© 2022 Selected Technologies LLC – Morgan Hill, California