33
/es/
AIzaSyAYiBZKx7MnpbEhh9jyipgxe19OcubqV5w
May 1, 2025
162709
Jamaica
JAM
true
2
1
Industry, value added (current LCU)
2016,2015,2014,2013,2012,2011,2010,2009,2008,2007,2006,2005,2004,2003,2002,2001,2000,1999,1998,1997,1996,1995,1994
Download
Estadísticas Globales de la Biblioteca →Jamaica →

Industry, value added (current LCU)

Estas estadísticas en otros países:

AfghanistanAlbaniaAlgeriaAndorraAngolaAntigua and BarbudaArgentinaArmeniaArubaAustraliaAustriaAzerbaijanBahamas, TheBahrainBangladeshBarbadosBelarusBelgiumBelizeBeninBermudaBhutanBoliviaBosnia and HerzegovinaBotswanaBrazilBrunei DarussalamBulgariaBurkina FasoBurundiCabo VerdeCambodiaCameroonCanadaCayman IslandsCentral African RepublicChadChileChinaColombiaComorosCongo, Dem. Rep.Congo, Rep.Costa RicaCote d'IvoireCroatiaCubaCyprusCzech RepublicDenmarkDjiboutiDominicaDominican RepublicEcuadorEgypt, Arab Rep.El SalvadorEquatorial GuineaEritreaEstoniaEthiopiaFijiFinlandFranceGabonGambia, TheGeorgiaGermanyGhanaGreeceGrenadaGuatemalaGuineaGuinea-BissauGuyanaHondurasHong Kong SAR, ChinaHungaryIcelandIndiaIndonesiaIran, Islamic Rep.IraqIrelandItalyJamaicaJapanJordanKazakhstanKenyaKiribatiKorea, Rep.KosovoKuwaitKyrgyz RepublicLao PDRLatviaLebanonLesothoLiberiaLibyaLiechtensteinLithuaniaLuxembourgMacao SAR, ChinaMacedonia, FYRMadagascarMalawiMalaysiaMaldivesMaliMaltaMarshall IslandsMauritaniaMauritiusMexicoMicronesia, Fed. Sts.MoldovaMongoliaMontenegroMoroccoMozambiqueMyanmarNamibiaNepalNetherlandsNew CaledoniaNew ZealandNicaraguaNigerNigeriaNorwayOmanPakistanPalauPanamaPapua New GuineaParaguayPeruPhilippinesPolandPortugalPuerto RicoQatarRomaniaRussian FederationRwandaSamoaSao Tome and PrincipeSaudi ArabiaSenegalSerbiaSeychellesSierra LeoneSingaporeSlovak RepublicSloveniaSolomon IslandsSomaliaSouth AfricaSpainSri LankaSt. Kitts and NevisSt. LuciaSt. Vincent and the GrenadinesSudanSurinameSwazilandSwedenSwitzerlandSyrian Arab RepublicTajikistanTanzaniaThailandTimor-LesteTogoTongaTrinidad and TobagoTunisiaTurkeyTurkmenistanTuvaluUgandaUkraineUnited Arab EmiratesUnited KingdomUnited StatesUruguayUzbekistanVanuatuVenezuela, RBVietnamWest Bank and GazaYemen, Rep.ZambiaZimbabwe

línea de tiempo (timeline):

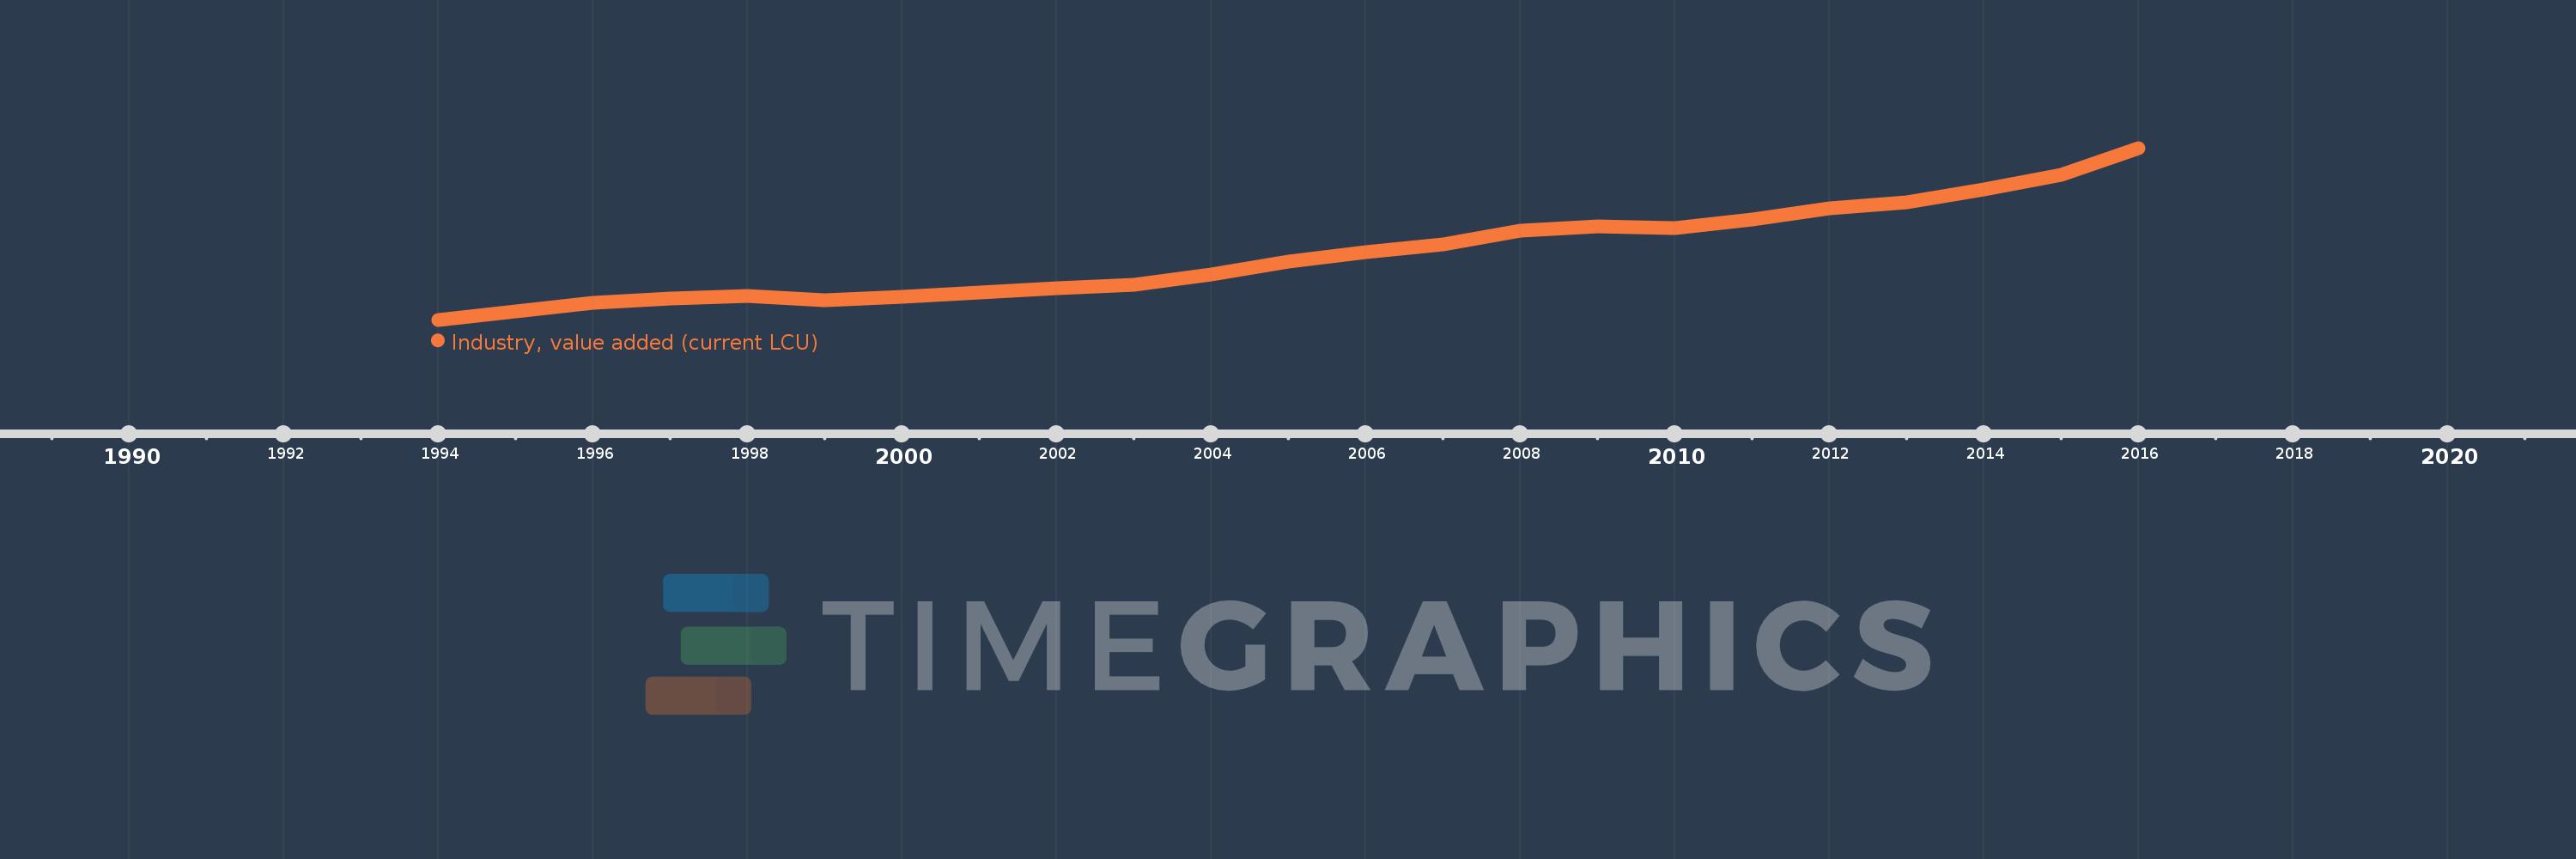
En esta escala de tiempo se presenta un gráfico de 1994 y 2016 de Jamaica. Los datos de 1993 están ausentes. El número de observaciones reales por fecha: 23.

Fuente (nombre):

Indicadores del desarrollo mundial

Fuente (organización):

World Bank national accounts data, and OECD National Accounts data files.

Categorías:

Economy & Growth

Se ha actualizado:

23 abr 2017 año

Los indicadores de los cambios de valor en los últimos años

En promedio:
149.983 bn
Mínimo:
41.954 bn
1 ene 1994 año
Máximo:
325.648 bn
1 ene 2016 año
A la fecha de observación
Valor
Cambio absoluto
El cambio con respecto al valor anterior
1 ene 1994 año
41.954 bn
+41.954 bn
0.0%
1 ene 1995 año
55.37 bn
+13.417 bn
31.98%
1 ene 1996 año
69.638 bn
+14.268 bn
25.77%
1 ene 1997 año
76.918 bn
+7.28 bn
10.45%
1 ene 1998 año
81.496 bn
+4.578 bn
5.95%
1 ene 1999 año
73.857 bn
-7.639 bn
-9.37%
1 ene 2000 año
79.76 bn
+5.903 bn
7.99%
1 ene 2001 año
87.501 bn
+7.741 bn
9.7%
1 ene 2002 año
94.562 bn
+7.061 bn
8.07%
1 ene 2003 año
100.335 bn
+5.773 bn
6.11%
1 ene 2004 año
117.029 bn
+16.694 bn
16.64%
1 ene 2005 año
138.594 bn
+21.565 bn
18.43%
1 ene 2006 año
153.365 bn
+14.771 bn
10.66%
1 ene 2007 año
166.437 bn
+13.072 bn
8.52%
1 ene 2008 año
188.776 bn
+22.339 bn
13.42%
1 ene 2009 año
196.428 bn
+7.652 bn
4.05%
1 ene 2010 año
192.753 bn
-3.675 bn
-1.87%
1 ene 2011 año
207.244 bn
+14.491 bn
7.52%
1 ene 2012 año
226.176 bn
+18.932 bn
9.14%
1 ene 2013 año
236.01 bn
+9.834 bn
4.35%
1 ene 2014 año
257.823 bn
+21.813 bn
9.24%
1 ene 2015 año
281.943 bn
+24.12 bn
9.36%
1 ene 2016 año
325.648 bn
+43.705 bn
15.5%

Ranking de los países por los datos estadísticos actuales