29
/es/
es
AIzaSyAYiBZKx7MnpbEhh9jyipgxe19OcubqV5w
April 1, 2024
139410
Germany
DEU
true
2
1
Industry, value added (current LCU)
2016,2015,2014,2013,2012,2011,2010,2009,2008,2007,2006,2005,2004,2003,2002,2001,2000,1999,1998,1997,1996,1995,1994,1993,1992
Download
Estadísticas Globales de la Biblioteca →Germany →

Industry, value added (current LCU)

Estas estadísticas en otros países:
AfghanistanAlbaniaAlgeriaAndorraAngolaAntigua and BarbudaArgentinaArmeniaArubaAustraliaAustriaAzerbaijanBahamas, TheBahrainBangladeshBarbadosBelarusBelgiumBelizeBeninBermudaBhutanBoliviaBosnia and HerzegovinaBotswanaBrazilBrunei DarussalamBulgariaBurkina FasoBurundiCabo VerdeCambodiaCameroonCanadaCayman IslandsCentral African RepublicChadChileChinaColombiaComorosCongo, Dem. Rep.Congo, Rep.Costa RicaCote d'IvoireCroatiaCubaCyprusCzech RepublicDenmarkDjiboutiDominicaDominican RepublicEcuadorEgypt, Arab Rep.El SalvadorEquatorial GuineaEritreaEstoniaEthiopiaFijiFinlandFranceGabonGambia, TheGeorgiaGermanyGhanaGreeceGrenadaGuatemalaGuineaGuinea-BissauGuyanaHondurasHong Kong SAR, ChinaHungaryIcelandIndiaIndonesiaIran, Islamic Rep.IraqIrelandItalyJamaicaJapanJordanKazakhstanKenyaKiribatiKorea, Rep.KosovoKuwaitKyrgyz RepublicLao PDRLatviaLebanonLesothoLiberiaLibyaLiechtensteinLithuaniaLuxembourgMacao SAR, ChinaMacedonia, FYRMadagascarMalawiMalaysiaMaldivesMaliMaltaMarshall IslandsMauritaniaMauritiusMexicoMicronesia, Fed. Sts.MoldovaMongoliaMontenegroMoroccoMozambiqueMyanmarNamibiaNepalNetherlandsNew CaledoniaNew ZealandNicaraguaNigerNigeriaNorwayOmanPakistanPalauPanamaPapua New GuineaParaguayPeruPhilippinesPolandPortugalPuerto RicoQatarRomaniaRussian FederationRwandaSamoaSao Tome and PrincipeSaudi ArabiaSenegalSerbiaSeychellesSierra LeoneSingaporeSlovak RepublicSloveniaSolomon IslandsSomaliaSouth AfricaSpainSri LankaSt. Kitts and NevisSt. LuciaSt. Vincent and the GrenadinesSudanSurinameSwazilandSwedenSwitzerlandSyrian Arab RepublicTajikistanTanzaniaThailandTimor-LesteTogoTongaTrinidad and TobagoTunisiaTurkeyTurkmenistanTuvaluUgandaUkraineUnited Arab EmiratesUnited KingdomUnited StatesUruguayUzbekistanVanuatuVenezuela, RBVietnamWest Bank and GazaYemen, Rep.ZambiaZimbabwe
línea de tiempo (timeline):
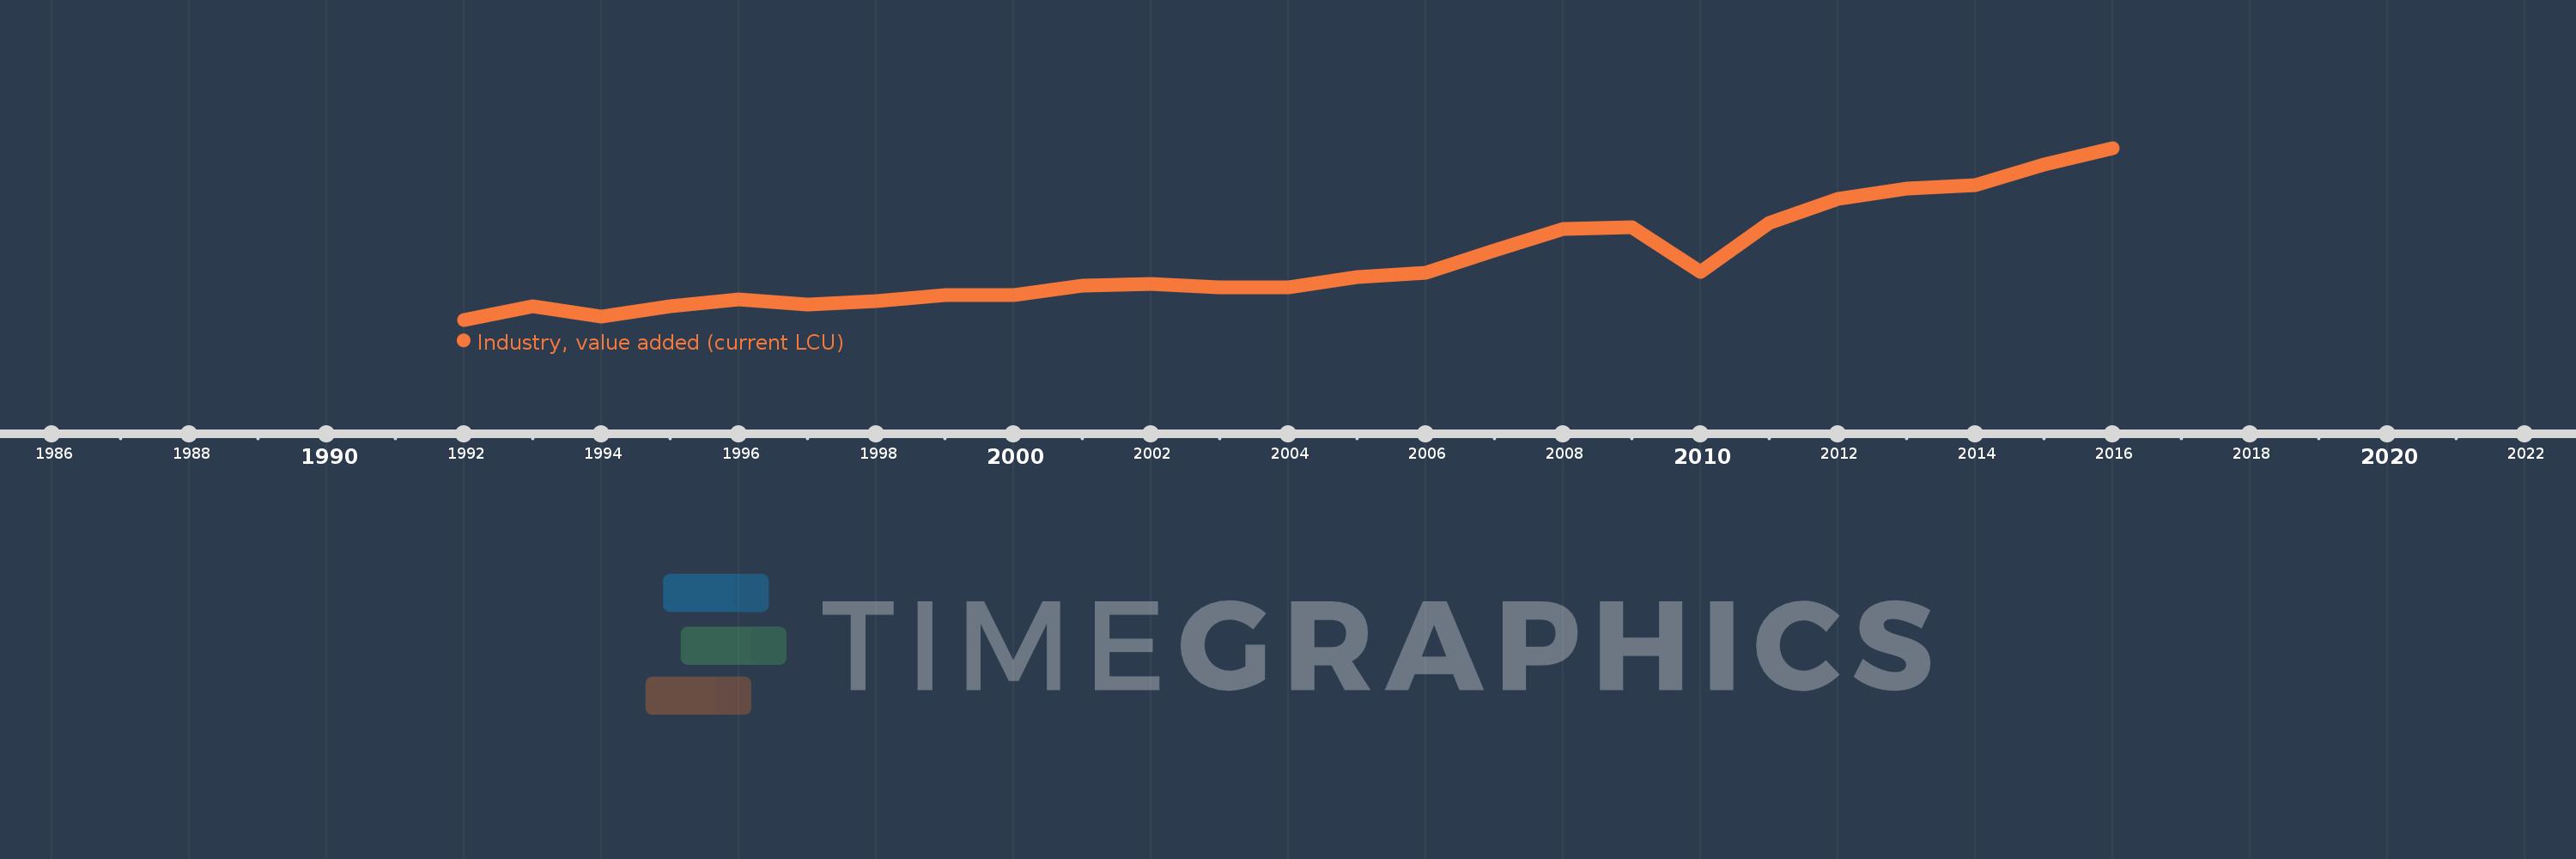
En esta escala de tiempo se presenta un gráfico de 1992 y 2016 de Germany. Los datos de 1991 están ausentes. El número de observaciones reales por fecha: 25.
Fuente (nombre):
Indicadores del desarrollo mundial
Fuente (organización):
World Bank national accounts data, and OECD National Accounts data files.
Categorías:
Economy & Growth
Se ha actualizado:
23 abr 2017 año
Los indicadores de los cambios de valor en los últimos años
En promedio:
633.481 bn
Mínimo:
530.241 bn
1 ene 1992 año
Máximo:
832.214 bn
1 ene 2016 año
A la fecha de observación
Valor
Cambio absoluto
El cambio con respecto al valor anterior
1 ene 1992 año
530.241 bn
+530.241 bn
0.0%
1 ene 1993 año
553.356 bn
+23.115 bn
4.36%
1 ene 1994 año
536.399 bn
-16.957 bn
-3.06%
1 ene 1995 año
554.201 bn
+17.802 bn
3.32%
1 ene 1996 año
566.255 bn
+12.054 bn
2.18%
1 ene 1997 año
556.501 bn
-9.754 bn
-1.72%
1 ene 1998 año
562.691 bn
+6.19 bn
1.11%
1 ene 1999 año
573.996 bn
+11.305 bn
2.01%
1 ene 2000 año
573.67 bn
-326.0 millones
-0.06%
1 ene 2001 año
590.081 bn
+16.411 bn
2.86%
1 ene 2002 año
593.234 bn
+3.153 bn
0.53%
1 ene 2003 año
586.792 bn
-6.442 bn
-1.09%
1 ene 2004 año
586.488 bn
-304.0 millones
-0.05%
1 ene 2005 año
605.256 bn
+18.768 bn
3.2%
1 ene 2006 año
612.083 bn
+6.827 bn
1.13%
1 ene 2007 año
652.179 bn
+40.096 bn
6.55%
1 ene 2008 año
690.429 bn
+38.25 bn
5.86%
1 ene 2009 año
692.856 bn
+2.427 bn
0.35%
1 ene 2010 año
613.782 bn
-79.074 bn
-11.41%
1 ene 2011 año
700.282 bn
+86.5 bn
14.09%
1 ene 2012 año
742.187 bn
+41.905 bn
5.98%
1 ene 2013 año
761.073 bn
+18.886 bn
2.54%
1 ene 2014 año
767.435 bn
+6.362 bn
0.84%
1 ene 2015 año
803.339 bn
+35.904 bn
4.68%
1 ene 2016 año
832.214 bn
+28.875 bn
3.59%
Ranking de los países por los datos estadísticos actuales

Comentarios:

Enviar
PremiumAbout & FeedbackAcuerdoPrivacidad
logo
© 2022 Selected Technologies LLC – Morgan Hill, California