29
/es/
es
AIzaSyAYiBZKx7MnpbEhh9jyipgxe19OcubqV5w
April 1, 2024
247688
Spain
ESP
true
2
1
Industry, value added (constant LCU)
2016,2015,2014,2013,2012,2011,2010,2009,2008,2007,2006,2005,2004,2003,2002,2001,2000,1999,1998,1997,1996
Download
Estadísticas Globales de la Biblioteca →Spain →

Industry, value added (constant LCU)

Estas estadísticas en otros países:
AfghanistanAlbaniaAlgeriaAntigua and BarbudaArgentinaArmeniaAustraliaAustriaAzerbaijanBahamas, TheBahrainBangladeshBelarusBelgiumBelizeBeninBermudaBhutanBoliviaBosnia and HerzegovinaBotswanaBrazilBrunei DarussalamBulgariaBurkina FasoBurundiCabo VerdeCambodiaCameroonCanadaCayman IslandsCentral African RepublicChadChileChinaColombiaComorosCongo, Dem. Rep.Congo, Rep.Costa RicaCote d'IvoireCroatiaCubaCyprusCzech RepublicDenmarkDjiboutiDominicaDominican RepublicEcuadorEgypt, Arab Rep.El SalvadorEquatorial GuineaEritreaEstoniaEthiopiaFijiFinlandFranceGabonGambia, TheGeorgiaGermanyGhanaGreeceGrenadaGuatemalaGuineaGuinea-BissauGuyanaHaitiHondurasHong Kong SAR, ChinaHungaryIcelandIndiaIndonesiaIran, Islamic Rep.IraqIrelandItalyJamaicaJapanJordanKazakhstanKenyaKiribatiKorea, Rep.KosovoKuwaitKyrgyz RepublicLao PDRLatviaLebanonLesothoLiberiaLithuaniaLuxembourgMacedonia, FYRMadagascarMalawiMalaysiaMaldivesMaliMarshall IslandsMauritaniaMauritiusMexicoMicronesia, Fed. Sts.MoldovaMongoliaMontenegroMoroccoMozambiqueMyanmarNamibiaNepalNetherlandsNew ZealandNicaraguaNigerNigeriaNorwayOmanPakistanPalauPanamaPapua New GuineaParaguayPeruPhilippinesPolandPortugalPuerto RicoQatarRomaniaRussian FederationRwandaSamoaSao Tome and PrincipeSaudi ArabiaSenegalSerbiaSeychellesSierra LeoneSingaporeSlovak RepublicSloveniaSolomon IslandsSomaliaSouth AfricaSpainSri LankaSt. Kitts and NevisSt. LuciaSt. Vincent and the GrenadinesSudanSurinameSwazilandSwedenSwitzerlandSyrian Arab RepublicTajikistanTanzaniaThailandTimor-LesteTogoTongaTrinidad and TobagoTunisiaTurkeyTurkmenistanTuvaluUgandaUkraineUnited Arab EmiratesUnited KingdomUnited StatesUruguayUzbekistanVanuatuVenezuela, RBVietnamWest Bank and GazaZambiaZimbabwe
línea de tiempo (timeline):
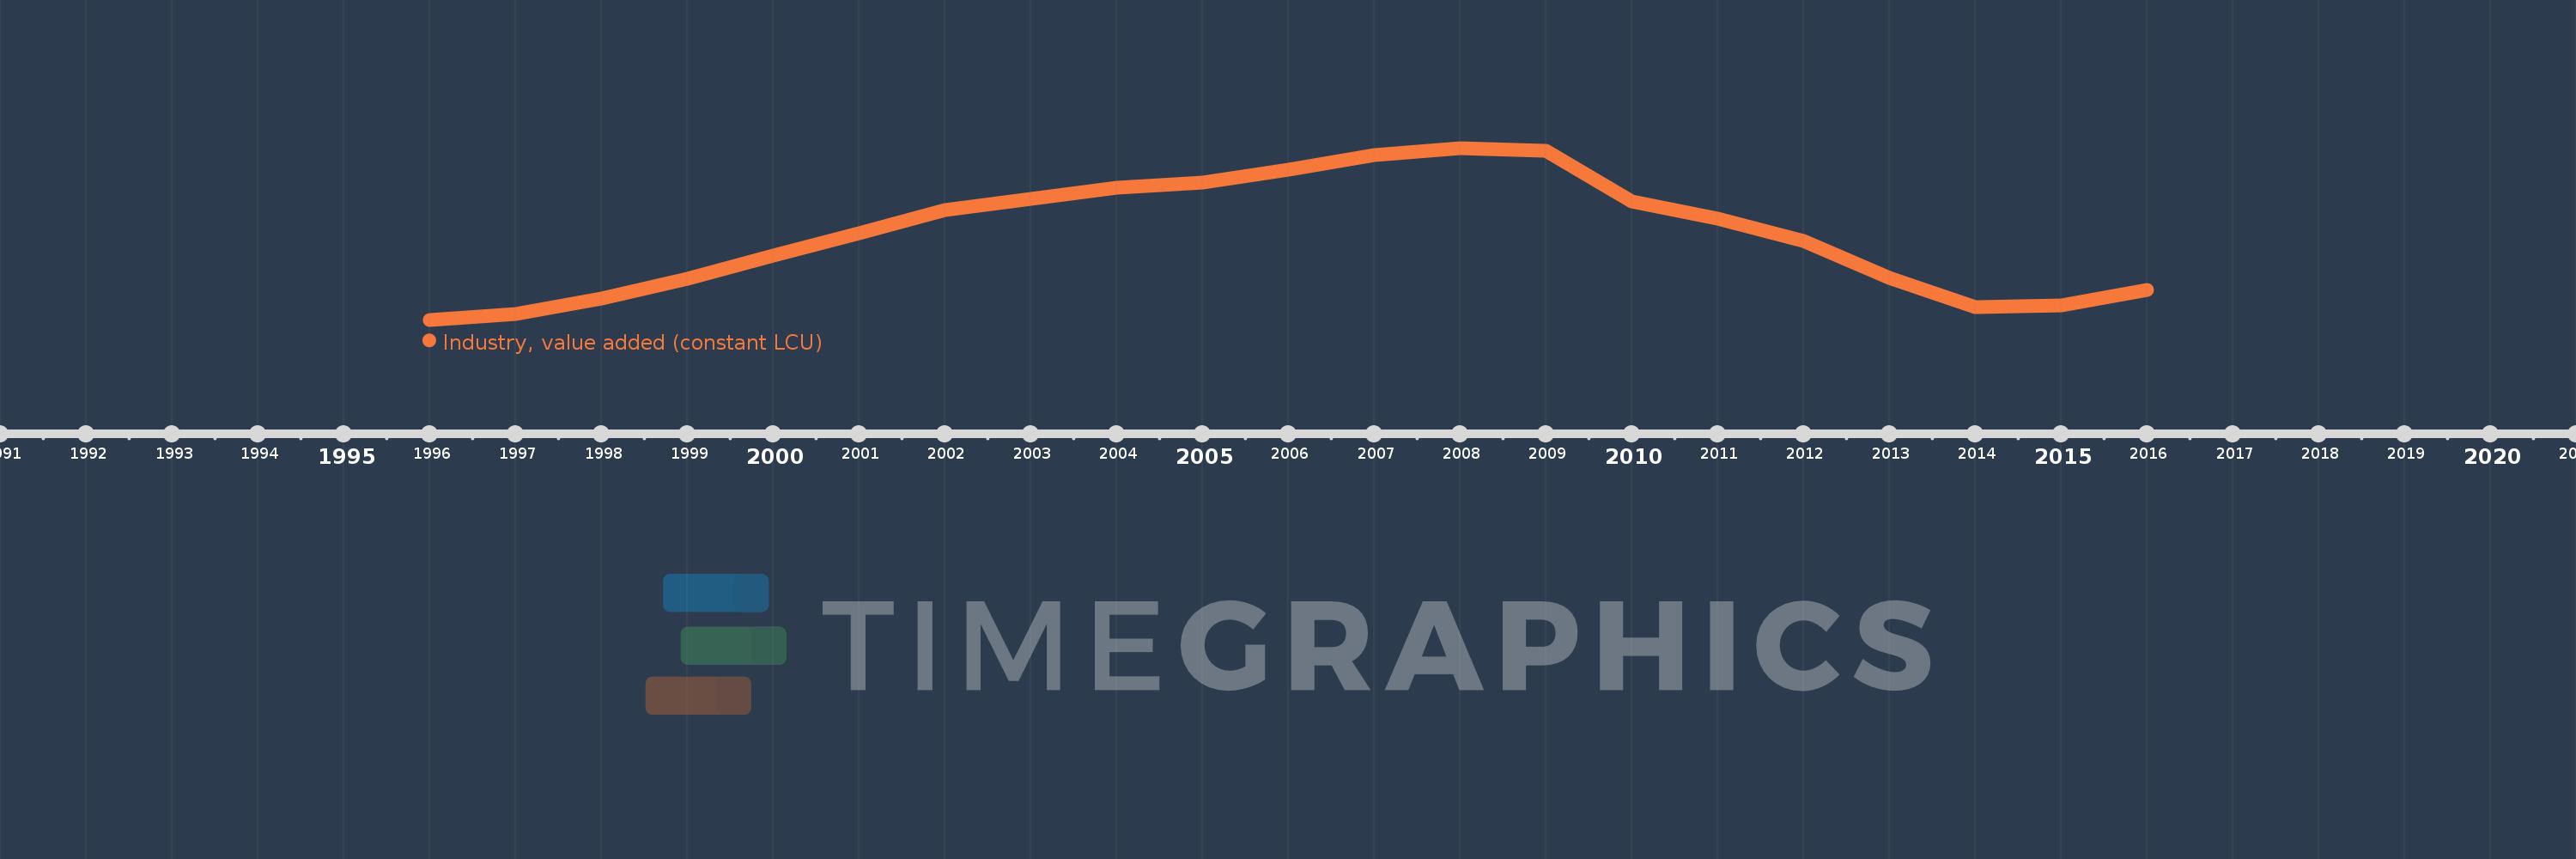
En esta escala de tiempo se presenta un gráfico de 1996 y 2016 de Spain. Los datos de 1995 están ausentes. El número de observaciones reales por fecha: 21.
Fuente (nombre):
Indicadores del desarrollo mundial
Fuente (organización):
World Bank national accounts data, and OECD National Accounts data files.
Categorías:
Economy & Growth
Se ha actualizado:
23 abr 2017 año
Los indicadores de los cambios de valor en los últimos años
En promedio:
248.929 bn
Mínimo:
205.17 bn
1 ene 1996 año
Máximo:
294.318 bn
1 ene 2008 año
A la fecha de observación
Valor
Cambio absoluto
El cambio con respecto al valor anterior
1 ene 1996 año
205.17 bn
+205.17 bn
0.0%
1 ene 1997 año
208.252 bn
+3.082 bn
1.5%
1 ene 1998 año
215.993 bn
+7.741 bn
3.72%
1 ene 1999 año
226.548 bn
+10.555 bn
4.89%
1 ene 2000 año
238.587 bn
+12.039 bn
5.31%
1 ene 2001 año
250.106 bn
+11.519 bn
4.83%
1 ene 2002 año
262.235 bn
+12.129 bn
4.85%
1 ene 2003 año
267.689 bn
+5.454 bn
2.08%
1 ene 2004 año
273.602 bn
+5.913 bn
2.21%
1 ene 2005 año
276.468 bn
+2.866 bn
1.05%
1 ene 2006 año
283.196 bn
+6.728 bn
2.43%
1 ene 2007 año
290.571 bn
+7.375 bn
2.6%
1 ene 2008 año
294.318 bn
+3.747 bn
1.29%
1 ene 2009 año
293.065 bn
-1.253 bn
-0.43%
1 ene 2010 año
266.448 bn
-26.617 bn
-9.08%
1 ene 2011 año
257.504 bn
-8.944 bn
-3.36%
1 ene 2012 año
245.928 bn
-11.576 bn
-4.5%
1 ene 2013 año
226.702 bn
-19.226 bn
-7.82%
1 ene 2014 año
211.904 bn
-14.798 bn
-6.53%
1 ene 2015 año
212.463 bn
+559.0 millones
0.26%
1 ene 2016 año
220.762 bn
+8.299 bn
3.91%
Ranking de los países por los datos estadísticos actuales

Comentarios:

Enviar
PremiumAbout & FeedbackAcuerdoPrivacidad
logo
© 2022 Selected Technologies LLC – Morgan Hill, California