33
/es/
AIzaSyAYiBZKx7MnpbEhh9jyipgxe19OcubqV5w
August 1, 2025
161609
Italy
ITA
true
2
1
Industry, value added (constant LCU)
2016,2015,2014,2013,2012,2011,2010,2009,2008,2007,2006,2005,2004,2003,2002,2001,2000,1999,1998,1997,1996,1995,1994,1993,1992,1991
Download
Estadísticas Globales de la Biblioteca →Italy →

Industry, value added (constant LCU)

Estas estadísticas en otros países:

AfghanistanAlbaniaAlgeriaAntigua and BarbudaArgentinaArmeniaAustraliaAustriaAzerbaijanBahamas, TheBahrainBangladeshBelarusBelgiumBelizeBeninBermudaBhutanBoliviaBosnia and HerzegovinaBotswanaBrazilBrunei DarussalamBulgariaBurkina FasoBurundiCabo VerdeCambodiaCameroonCanadaCayman IslandsCentral African RepublicChadChileChinaColombiaComorosCongo, Dem. Rep.Congo, Rep.Costa RicaCote d'IvoireCroatiaCubaCyprusCzech RepublicDenmarkDjiboutiDominicaDominican RepublicEcuadorEgypt, Arab Rep.El SalvadorEquatorial GuineaEritreaEstoniaEthiopiaFijiFinlandFranceGabonGambia, TheGeorgiaGermanyGhanaGreeceGrenadaGuatemalaGuineaGuinea-BissauGuyanaHaitiHondurasHong Kong SAR, ChinaHungaryIcelandIndiaIndonesiaIran, Islamic Rep.IraqIrelandItalyJamaicaJapanJordanKazakhstanKenyaKiribatiKorea, Rep.KosovoKuwaitKyrgyz RepublicLao PDRLatviaLebanonLesothoLiberiaLithuaniaLuxembourgMacedonia, FYRMadagascarMalawiMalaysiaMaldivesMaliMarshall IslandsMauritaniaMauritiusMexicoMicronesia, Fed. Sts.MoldovaMongoliaMontenegroMoroccoMozambiqueMyanmarNamibiaNepalNetherlandsNew ZealandNicaraguaNigerNigeriaNorwayOmanPakistanPalauPanamaPapua New GuineaParaguayPeruPhilippinesPolandPortugalPuerto RicoQatarRomaniaRussian FederationRwandaSamoaSao Tome and PrincipeSaudi ArabiaSenegalSerbiaSeychellesSierra LeoneSingaporeSlovak RepublicSloveniaSolomon IslandsSomaliaSouth AfricaSpainSri LankaSt. Kitts and NevisSt. LuciaSt. Vincent and the GrenadinesSudanSurinameSwazilandSwedenSwitzerlandSyrian Arab RepublicTajikistanTanzaniaThailandTimor-LesteTogoTongaTrinidad and TobagoTunisiaTurkeyTurkmenistanTuvaluUgandaUkraineUnited Arab EmiratesUnited KingdomUnited StatesUruguayUzbekistanVanuatuVenezuela, RBVietnamWest Bank and GazaZambiaZimbabwe

línea de tiempo (timeline):

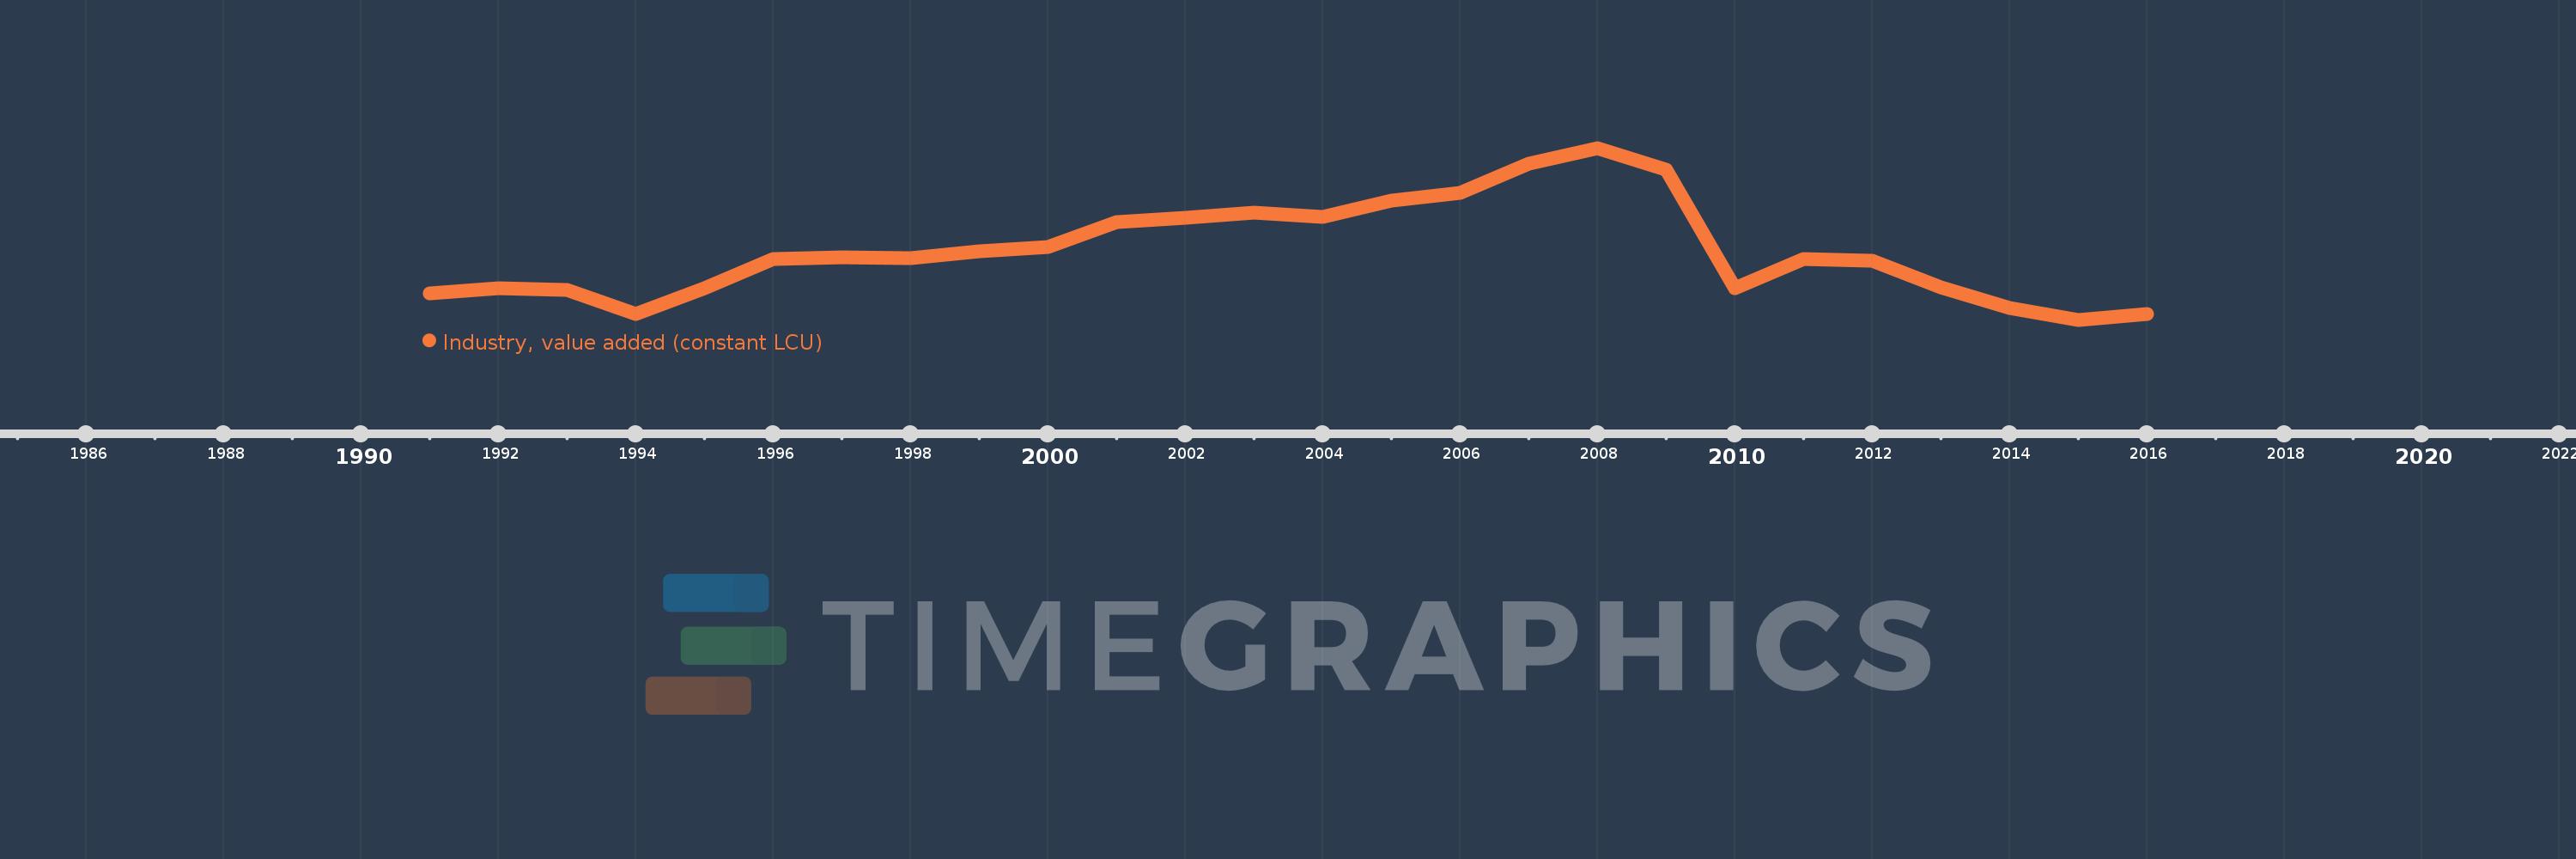
En esta escala de tiempo se presenta un gráfico de 1991 y 2016 de Italy. Los datos de 1990 están ausentes. El número de observaciones reales por fecha: 26.

Fuente (nombre):

Indicadores del desarrollo mundial

Fuente (organización):

World Bank national accounts data, and OECD National Accounts data files.

Categorías:

Economy & Growth

Se ha actualizado:

23 abr 2017 año

Los indicadores de los cambios de valor en los últimos años

En promedio:
355.369 bn
Mínimo:
323.334 bn
1 ene 2015 año
Máximo:
403.43 bn
1 ene 2008 año
A la fecha de observación
Valor
Cambio absoluto
El cambio con respecto al valor anterior
1 ene 1991 año
335.822 bn
+335.822 bn
0.0%
1 ene 1992 año
337.972 bn
+2.15 bn
0.64%
1 ene 1993 año
337.039 bn
-932.784 millones
-0.28%
1 ene 1994 año
325.961 bn
-11.077 bn
-3.29%
1 ene 1995 año
338.219 bn
+12.257 bn
3.76%
1 ene 1996 año
351.478 bn
+13.259 bn
3.92%
1 ene 1997 año
352.402 bn
+923.863 millones
0.26%
1 ene 1998 año
352.217 bn
-184.413 millones
-0.05%
1 ene 1999 año
355.434 bn
+3.217 bn
0.91%
1 ene 2000 año
357.449 bn
+2.015 bn
0.57%
1 ene 2001 año
368.914 bn
+11.465 bn
3.21%
1 ene 2002 año
371.025 bn
+2.111 bn
0.57%
1 ene 2003 año
373.464 bn
+2.439 bn
0.66%
1 ene 2004 año
371.276 bn
-2.189 bn
-0.59%
1 ene 2005 año
379.026 bn
+7.75 bn
2.09%
1 ene 2006 año
382.488 bn
+3.462 bn
0.91%
1 ene 2007 año
396.079 bn
+13.591 bn
3.55%
1 ene 2008 año
403.43 bn
+7.35 bn
1.86%
1 ene 2009 año
393.104 bn
-10.326 bn
-2.56%
1 ene 2010 año
338.162 bn
-54.942 bn
-13.98%
1 ene 2011 año
351.787 bn
+13.625 bn
4.03%
1 ene 2012 año
350.655 bn
-1.132 bn
-0.32%
1 ene 2013 año
338.255 bn
-12.399 bn
-3.54%
1 ene 2014 año
328.643 bn
-9.612 bn
-2.84%
1 ene 2015 año
323.334 bn
-5.309 bn
-1.62%
1 ene 2016 año
325.959 bn
+2.625 bn
0.81%

Ranking de los países por los datos estadísticos actuales