30
/es/
AIzaSyAYiBZKx7MnpbEhh9jyipgxe19OcubqV5w
April 1, 2024
224990
Poland
POL
true
2
1
Industry, value added (constant LCU)
2016,2015,2014,2013,2012,2011,2010,2009,2008,2007,2006,2005,2004,2003,2002,2001,2000,1999,1998,1997
Download
Estadísticas Globales de la Biblioteca →Poland →

Industry, value added (constant LCU)

Estas estadísticas en otros países:

AfghanistanAlbaniaAlgeriaAntigua and BarbudaArgentinaArmeniaAustraliaAustriaAzerbaijanBahamas, TheBahrainBangladeshBelarusBelgiumBelizeBeninBermudaBhutanBoliviaBosnia and HerzegovinaBotswanaBrazilBrunei DarussalamBulgariaBurkina FasoBurundiCabo VerdeCambodiaCameroonCanadaCayman IslandsCentral African RepublicChadChileChinaColombiaComorosCongo, Dem. Rep.Congo, Rep.Costa RicaCote d'IvoireCroatiaCubaCyprusCzech RepublicDenmarkDjiboutiDominicaDominican RepublicEcuadorEgypt, Arab Rep.El SalvadorEquatorial GuineaEritreaEstoniaEthiopiaFijiFinlandFranceGabonGambia, TheGeorgiaGermanyGhanaGreeceGrenadaGuatemalaGuineaGuinea-BissauGuyanaHaitiHondurasHong Kong SAR, ChinaHungaryIcelandIndiaIndonesiaIran, Islamic Rep.IraqIrelandItalyJamaicaJapanJordanKazakhstanKenyaKiribatiKorea, Rep.KosovoKuwaitKyrgyz RepublicLao PDRLatviaLebanonLesothoLiberiaLithuaniaLuxembourgMacedonia, FYRMadagascarMalawiMalaysiaMaldivesMaliMarshall IslandsMauritaniaMauritiusMexicoMicronesia, Fed. Sts.MoldovaMongoliaMontenegroMoroccoMozambiqueMyanmarNamibiaNepalNetherlandsNew ZealandNicaraguaNigerNigeriaNorwayOmanPakistanPalauPanamaPapua New GuineaParaguayPeruPhilippinesPolandPortugalPuerto RicoQatarRomaniaRussian FederationRwandaSamoaSao Tome and PrincipeSaudi ArabiaSenegalSerbiaSeychellesSierra LeoneSingaporeSlovak RepublicSloveniaSolomon IslandsSomaliaSouth AfricaSpainSri LankaSt. Kitts and NevisSt. LuciaSt. Vincent and the GrenadinesSudanSurinameSwazilandSwedenSwitzerlandSyrian Arab RepublicTajikistanTanzaniaThailandTimor-LesteTogoTongaTrinidad and TobagoTunisiaTurkeyTurkmenistanTuvaluUgandaUkraineUnited Arab EmiratesUnited KingdomUnited StatesUruguayUzbekistanVanuatuVenezuela, RBVietnamWest Bank and GazaZambiaZimbabwe

línea de tiempo (timeline):

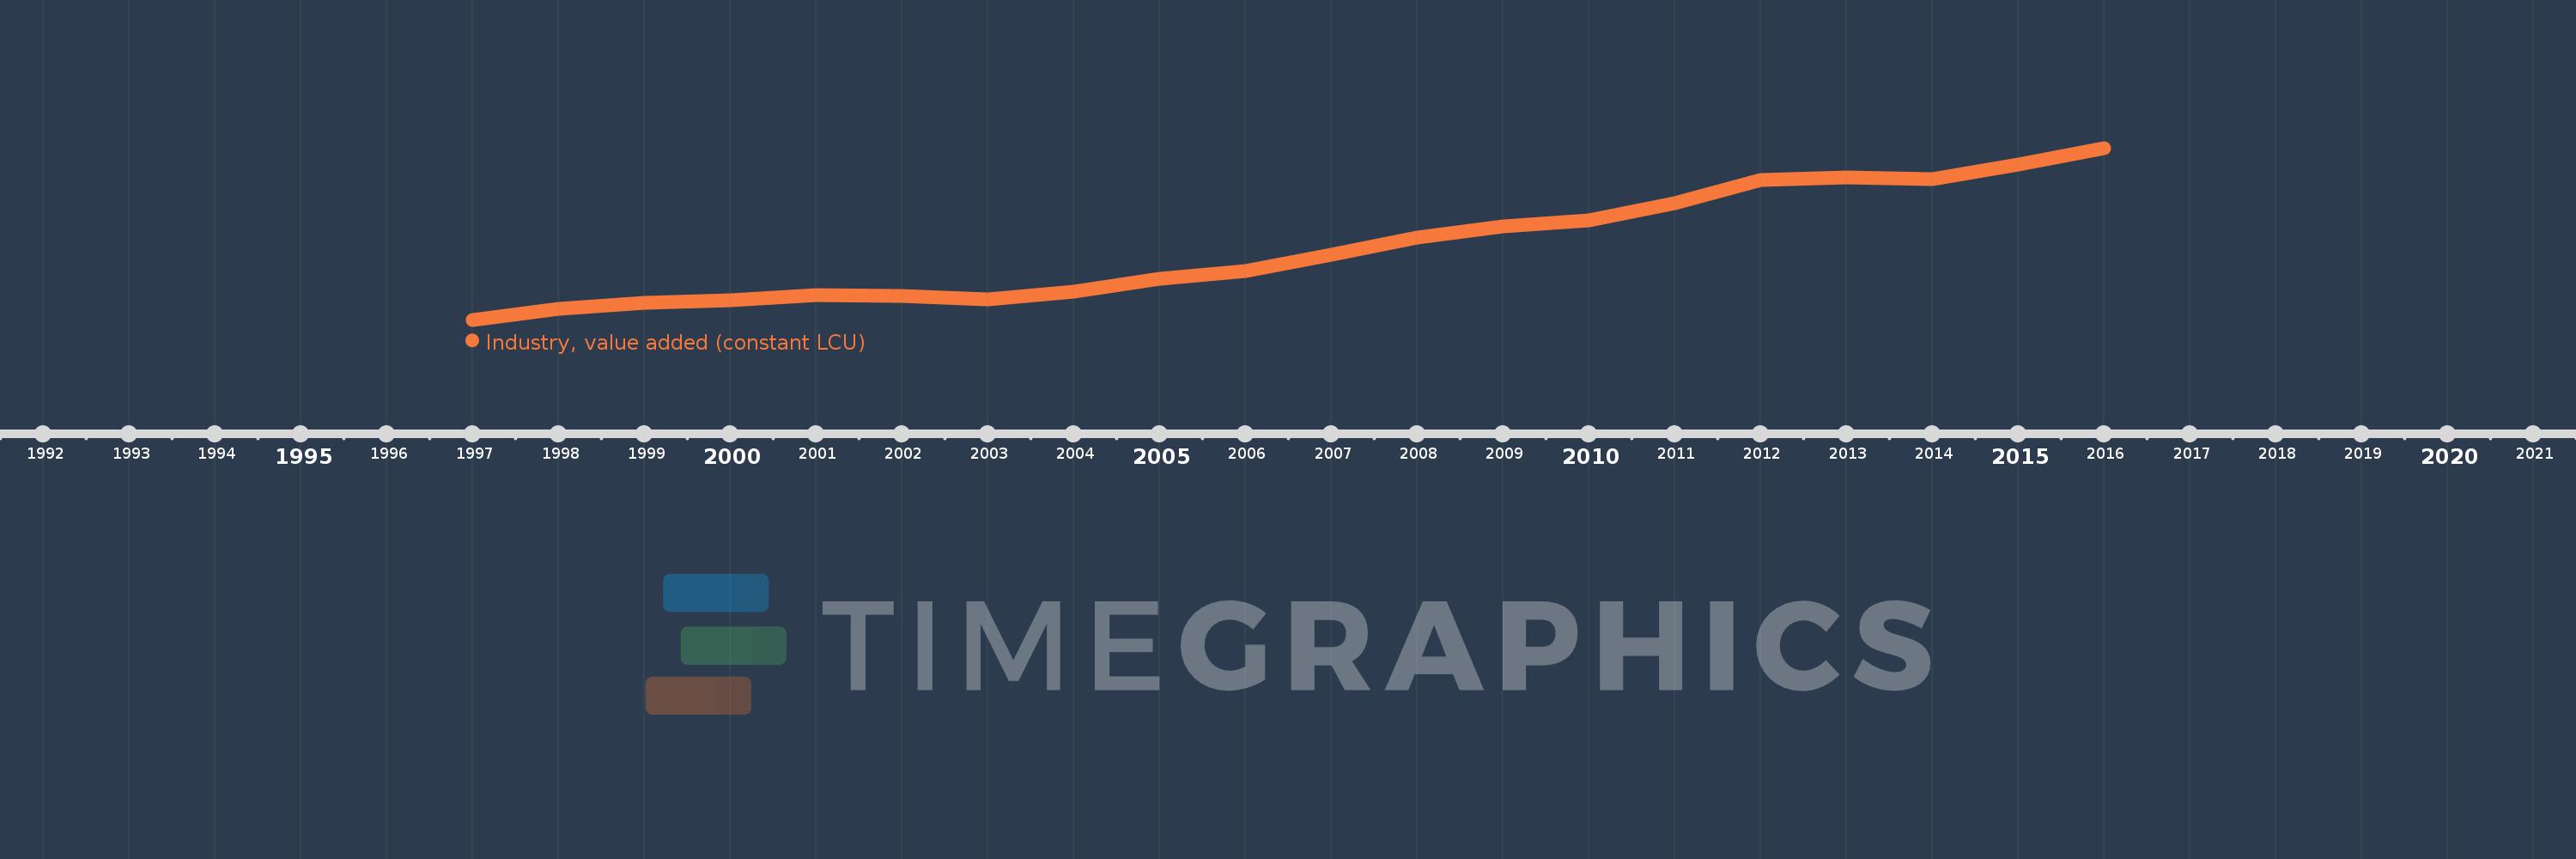
En esta escala de tiempo se presenta un gráfico de 1997 y 2016 de Poland. Los datos de 1996 están ausentes. El número de observaciones reales por fecha: 20.

Fuente (nombre):

Indicadores del desarrollo mundial

Fuente (organización):

World Bank national accounts data, and OECD National Accounts data files.

Categorías:

Economy & Growth

Se ha actualizado:

23 abr 2017 año

Los indicadores de los cambios de valor en los últimos años

En promedio:
345.073 bn
Mínimo:
221.34 bn
1 ene 1997 año
Máximo:
516.623 bn
1 ene 2016 año
A la fecha de observación
Valor
Cambio absoluto
El cambio con respecto al valor anterior
1 ene 1997 año
221.34 bn
+221.34 bn
0.0%
1 ene 1998 año
240.009 bn
+18.669 bn
8.43%
1 ene 1999 año
249.842 bn
+9.833 bn
4.1%
1 ene 2000 año
255.548 bn
+5.706 bn
2.28%
1 ene 2001 año
264.346 bn
+8.798 bn
3.44%
1 ene 2002 año
261.881 bn
-2.466 bn
-0.93%
1 ene 2003 año
256.946 bn
-4.934 bn
-1.88%
1 ene 2004 año
270.024 bn
+13.078 bn
5.09%
1 ene 2005 año
291.459 bn
+21.435 bn
7.94%
1 ene 2006 año
304.339 bn
+12.88 bn
4.42%
1 ene 2007 año
333.239 bn
+28.9 bn
9.5%
1 ene 2008 año
362.576 bn
+29.337 bn
8.8%
1 ene 2009 año
381.955 bn
+19.379 bn
5.34%
1 ene 2010 año
392.295 bn
+10.341 bn
2.71%
1 ene 2011 año
421.694 bn
+29.399 bn
7.49%
1 ene 2012 año
460.98 bn
+39.286 bn
9.32%
1 ene 2013 año
465.491 bn
+4.511 bn
0.98%
1 ene 2014 año
462.555 bn
-2.936 bn
-0.63%
1 ene 2015 año
488.326 bn
+25.771 bn
5.57%
1 ene 2016 año
516.623 bn
+28.297 bn
5.79%

Ranking de los países por los datos estadísticos actuales