33
/es/
AIzaSyAYiBZKx7MnpbEhh9jyipgxe19OcubqV5w
August 1, 2025
114946
Croatia
HRV
true
2
1
Industry, value added (constant LCU)
2016,2015,2014,2013,2012,2011,2010,2009,2008,2007,2006,2005,2004,2003,2002,2001,2000,1999,1998,1997,1996
Download
Estadísticas Globales de la Biblioteca →Croatia →

Industry, value added (constant LCU)

Estas estadísticas en otros países:

AfghanistanAlbaniaAlgeriaAntigua and BarbudaArgentinaArmeniaAustraliaAustriaAzerbaijanBahamas, TheBahrainBangladeshBelarusBelgiumBelizeBeninBermudaBhutanBoliviaBosnia and HerzegovinaBotswanaBrazilBrunei DarussalamBulgariaBurkina FasoBurundiCabo VerdeCambodiaCameroonCanadaCayman IslandsCentral African RepublicChadChileChinaColombiaComorosCongo, Dem. Rep.Congo, Rep.Costa RicaCote d'IvoireCroatiaCubaCyprusCzech RepublicDenmarkDjiboutiDominicaDominican RepublicEcuadorEgypt, Arab Rep.El SalvadorEquatorial GuineaEritreaEstoniaEthiopiaFijiFinlandFranceGabonGambia, TheGeorgiaGermanyGhanaGreeceGrenadaGuatemalaGuineaGuinea-BissauGuyanaHaitiHondurasHong Kong SAR, ChinaHungaryIcelandIndiaIndonesiaIran, Islamic Rep.IraqIrelandItalyJamaicaJapanJordanKazakhstanKenyaKiribatiKorea, Rep.KosovoKuwaitKyrgyz RepublicLao PDRLatviaLebanonLesothoLiberiaLithuaniaLuxembourgMacedonia, FYRMadagascarMalawiMalaysiaMaldivesMaliMarshall IslandsMauritaniaMauritiusMexicoMicronesia, Fed. Sts.MoldovaMongoliaMontenegroMoroccoMozambiqueMyanmarNamibiaNepalNetherlandsNew ZealandNicaraguaNigerNigeriaNorwayOmanPakistanPalauPanamaPapua New GuineaParaguayPeruPhilippinesPolandPortugalPuerto RicoQatarRomaniaRussian FederationRwandaSamoaSao Tome and PrincipeSaudi ArabiaSenegalSerbiaSeychellesSierra LeoneSingaporeSlovak RepublicSloveniaSolomon IslandsSomaliaSouth AfricaSpainSri LankaSt. Kitts and NevisSt. LuciaSt. Vincent and the GrenadinesSudanSurinameSwazilandSwedenSwitzerlandSyrian Arab RepublicTajikistanTanzaniaThailandTimor-LesteTogoTongaTrinidad and TobagoTunisiaTurkeyTurkmenistanTuvaluUgandaUkraineUnited Arab EmiratesUnited KingdomUnited StatesUruguayUzbekistanVanuatuVenezuela, RBVietnamWest Bank and GazaZambiaZimbabwe

línea de tiempo (timeline):

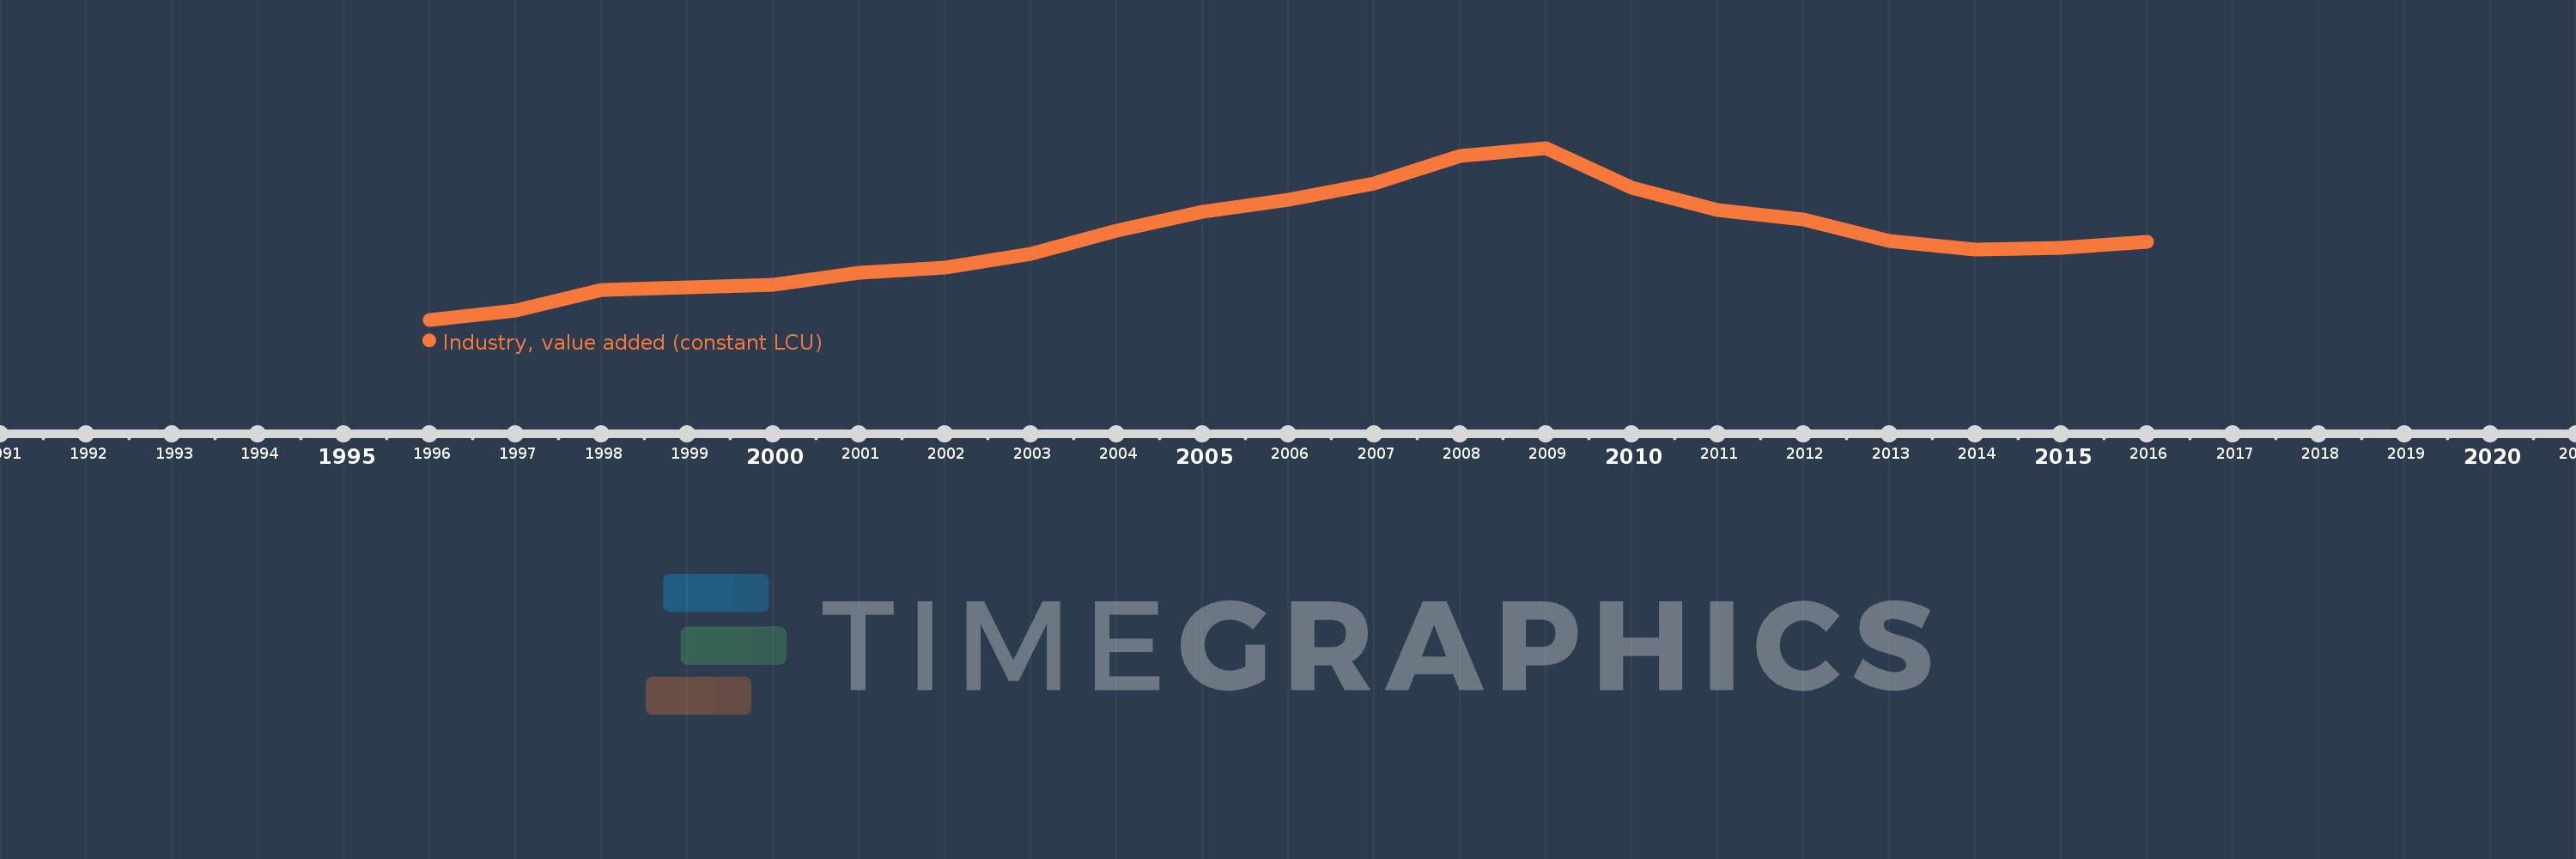
En esta escala de tiempo se presenta un gráfico de 1996 y 2016 de Croatia. Los datos de 1995 están ausentes. El número de observaciones reales por fecha: 21.

Fuente (nombre):

Indicadores del desarrollo mundial

Fuente (organización):

World Bank national accounts data, and OECD National Accounts data files.

Categorías:

Economy & Growth

Se ha actualizado:

23 abr 2017 año

Los indicadores de los cambios de valor en los últimos años

En promedio:
69.382 bn
Mínimo:
51.194 bn
1 ene 1996 año
Máximo:
89.797 bn
1 ene 2009 año
A la fecha de observación
Valor
Cambio absoluto
El cambio con respecto al valor anterior
1 ene 1996 año
51.194 bn
+51.194 bn
0.0%
1 ene 1997 año
53.201 bn
+2.007 bn
3.92%
1 ene 1998 año
57.929 bn
+4.728 bn
8.89%
1 ene 1999 año
58.436 bn
+506.988 millones
0.88%
1 ene 2000 año
58.962 bn
+525.43 millones
0.9%
1 ene 2001 año
61.678 bn
+2.717 bn
4.61%
1 ene 2002 año
62.969 bn
+1.291 bn
2.09%
1 ene 2003 año
66.088 bn
+3.119 bn
4.95%
1 ene 2004 año
71.215 bn
+5.128 bn
7.76%
1 ene 2005 año
75.36 bn
+4.145 bn
5.82%
1 ene 2006 año
78.182 bn
+2.822 bn
3.74%
1 ene 2007 año
81.761 bn
+3.579 bn
4.58%
1 ene 2008 año
88.064 bn
+6.303 bn
7.71%
1 ene 2009 año
89.797 bn
+1.734 bn
1.97%
1 ene 2010 año
80.783 bn
-9.014 bn
-10.04%
1 ene 2011 año
75.898 bn
-4.885 bn
-6.05%
1 ene 2012 año
73.681 bn
-2.217 bn
-2.92%
1 ene 2013 año
68.89 bn
-4.791 bn
-6.5%
1 ene 2014 año
66.99 bn
-1.9 bn
-2.76%
1 ene 2015 año
67.34 bn
+350.879 millones
0.52%
1 ene 2016 año
68.609 bn
+1.268 bn
1.88%

Ranking de los países por los datos estadísticos actuales