29
/es/
es
AIzaSyAYiBZKx7MnpbEhh9jyipgxe19OcubqV5w
April 1, 2024
204991
Namibia
NAM
true
2
1
Broad money (current LCU)
2016,2015,2014,2013,2012,2011,2010,2009,2008,2007,2006,2005,2004,2003,2002,2001,2000,1999,1998,1997,1996,1995,1994,1993,1992,1991
Download
Estadísticas Globales de la Biblioteca →Namibia →

Broad money (current LCU)

Estas estadísticas en otros países:
AfghanistanAlbaniaAlgeriaAngolaAntigua and BarbudaArgentinaArmeniaArubaAustraliaAzerbaijanBahamas, TheBahrainBangladeshBarbadosBelarusBelizeBeninBhutanBoliviaBosnia and HerzegovinaBotswanaBrazilBrunei DarussalamBulgariaBurkina FasoBurundiCabo VerdeCambodiaCameroonCanadaCentral African RepublicChadChileChinaColombiaComorosCongo, Dem. Rep.Congo, Rep.Costa RicaCote d'IvoireCroatiaCzech RepublicDenmarkDjiboutiDominicaDominican RepublicEcuadorEgypt, Arab Rep.El SalvadorEquatorial GuineaEritreaEstoniaEthiopiaEuro areaFijiGabonGambia, TheGeorgiaGhanaGrenadaGuatemalaGuineaGuinea-BissauGuyanaHaitiHondurasHong Kong SAR, ChinaHungaryIcelandIndiaIndonesiaIran, Islamic Rep.IraqIsraelJamaicaJapanJordanKazakhstanKenyaKorea, Rep.KuwaitKyrgyz RepublicLao PDRLatviaLebanonLesothoLiberiaLibyaLithuaniaMacao SAR, ChinaMacedonia, FYRMadagascarMalawiMalaysiaMaldivesMaliMauritaniaMauritiusMexicoMicronesia, Fed. Sts.MoldovaMongoliaMoroccoMozambiqueMyanmarNamibiaNepalNew ZealandNicaraguaNigerNigeriaNorwayOmanPakistanPanamaPapua New GuineaParaguayPeruPhilippinesPolandQatarRomaniaRussian FederationRwandaSamoaSao Tome and PrincipeSaudi ArabiaSenegalSerbiaSeychellesSierra LeoneSingaporeSlovak RepublicSolomon IslandsSouth AfricaSouth SudanSri LankaSt. Kitts and NevisSt. LuciaSt. Vincent and the GrenadinesSudanSurinameSwazilandSwedenSwitzerlandSyrian Arab RepublicTajikistanTanzaniaThailandTimor-LesteTogoTongaTrinidad and TobagoTunisiaTurkeyUgandaUkraineUnited Arab EmiratesUnited KingdomUnited StatesUruguayVanuatuVenezuela, RBVietnamWest Bank and GazaYemen, Rep.ZambiaZimbabwe
línea de tiempo (timeline):
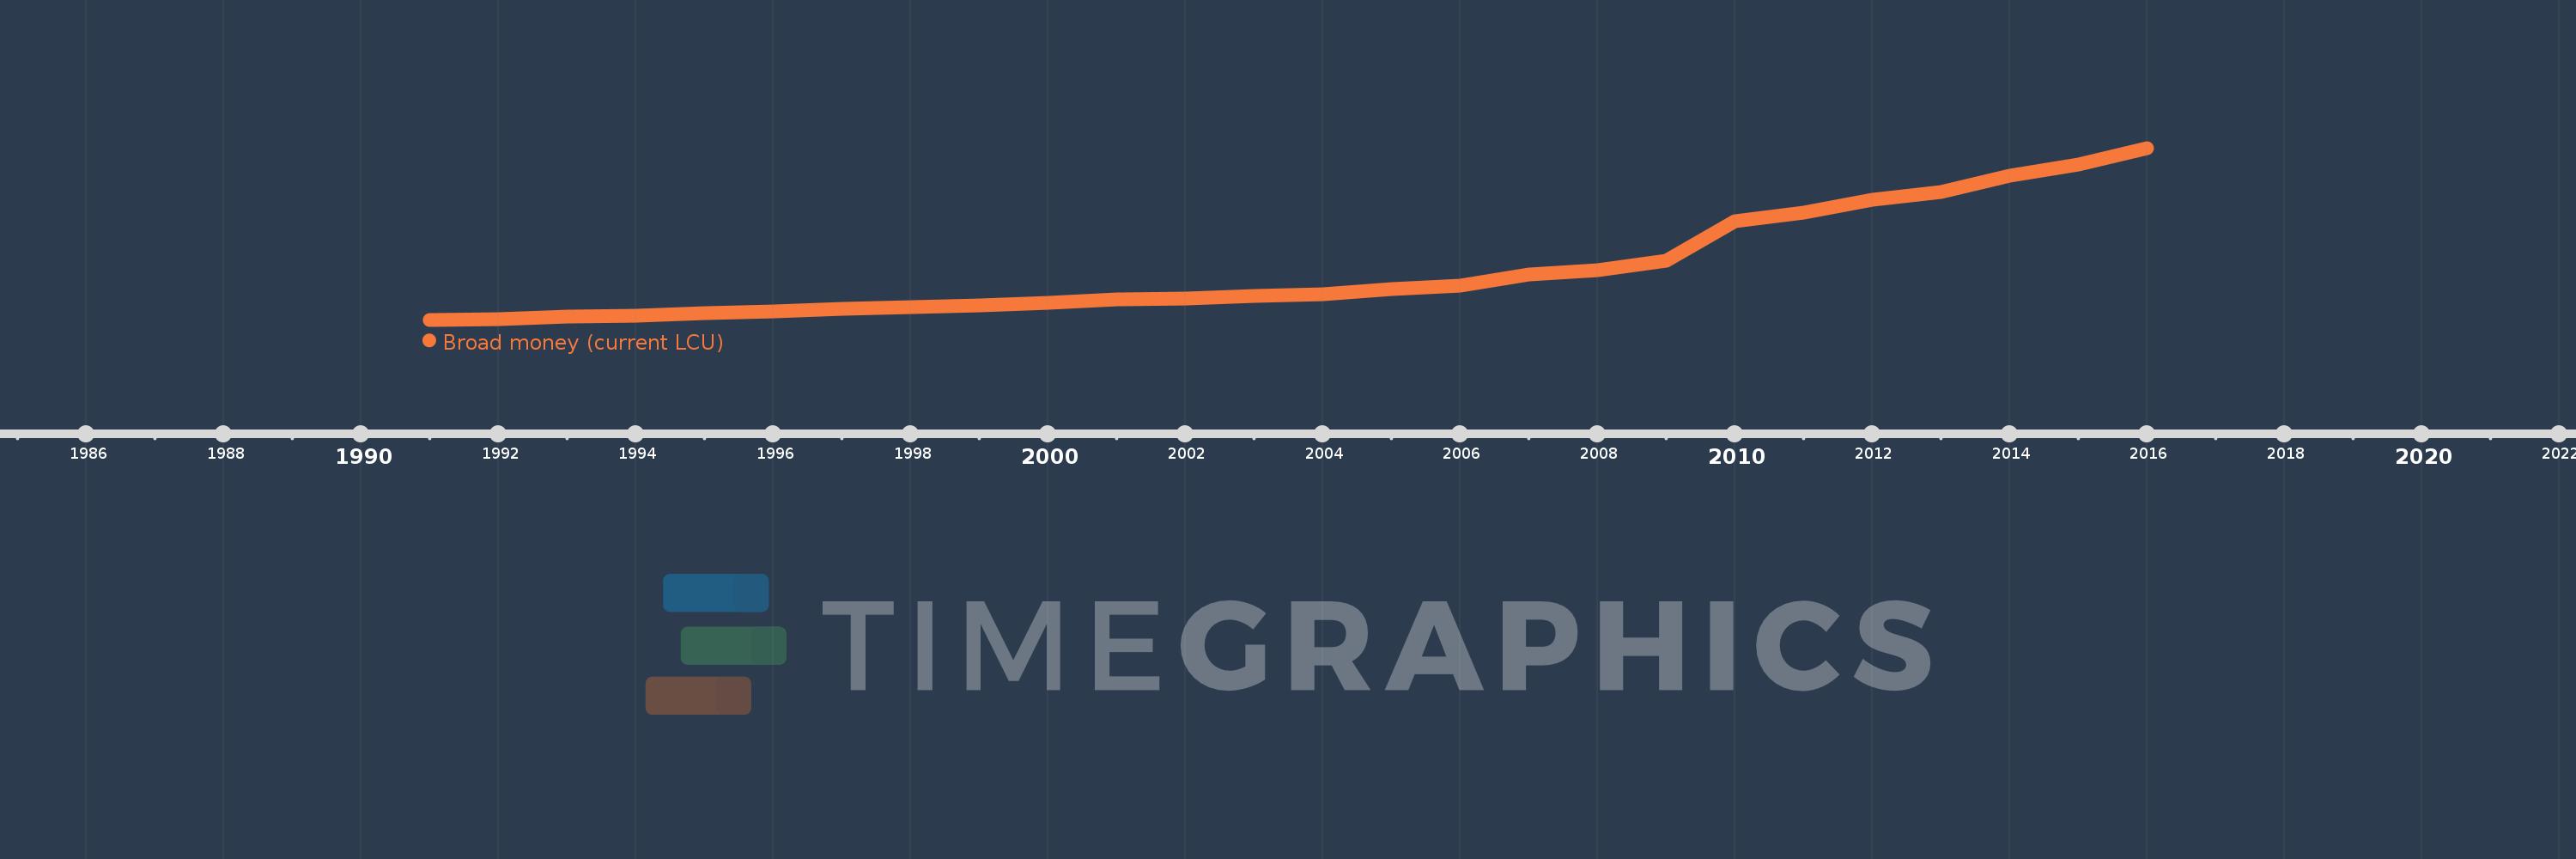
En esta escala de tiempo se presenta un gráfico de 1991 y 2016 de Namibia. Los datos de 1990 están ausentes. El número de observaciones reales por fecha: 26.
Fuente (nombre):
Indicadores del desarrollo mundial
Fuente (organización):
International Monetary Fund, International Financial Statistics and data files.
Categorías:
Financial Sector
Se ha actualizado:
23 abr 2017 año
Los indicadores de los cambios de valor en los últimos años
En promedio:
25.106 bn
Mínimo:
1.477 bn
1 ene 1991 año
Máximo:
81.945 bn
1 ene 2016 año
A la fecha de observación
Valor
Cambio absoluto
El cambio con respecto al valor anterior
1 ene 1991 año
1.477 bn
+1.477 bn
0.0%
1 ene 1992 año
1.925 bn
+447.609 millones
30.3%
1 ene 1993 año
2.822 bn
+896.489 millones
46.57%
1 ene 1994 año
3.369 bn
+547.614 millones
19.41%
1 ene 1995 año
4.411 bn
+1.042 bn
30.93%
1 ene 1996 año
5.408 bn
+996.451 millones
22.59%
1 ene 1997 año
6.71 bn
+1.302 bn
24.08%
1 ene 1998 año
7.252 bn
+542.745 millones
8.09%
1 ene 1999 año
8.017 bn
+765.104 millones
10.55%
1 ene 2000 año
9.58 bn
+1.563 bn
19.5%
1 ene 2001 año
10.845 bn
+1.265 bn
13.2%
1 ene 2002 año
11.514 bn
+668.91 millones
6.17%
1 ene 2003 año
12.434 bn
+919.65 millones
7.99%
1 ene 2004 año
13.627 bn
+1.193 bn
9.59%
1 ene 2005 año
15.822 bn
+2.195 bn
16.11%
1 ene 2006 año
17.37 bn
+1.549 bn
9.79%
1 ene 2007 año
22.518 bn
+5.148 bn
29.64%
1 ene 2008 año
24.808 bn
+2.29 bn
10.17%
1 ene 2009 año
29.241 bn
+4.433 bn
17.87%
1 ene 2010 año
47.731 bn
+18.491 bn
63.24%
1 ene 2011 año
51.567 bn
+3.836 bn
8.04%
1 ene 2012 año
57.71 bn
+6.143 bn
11.91%
1 ene 2013 año
61.33 bn
+3.62 bn
6.27%
1 ene 2014 año
68.958 bn
+7.628 bn
12.44%
1 ene 2015 año
74.366 bn
+5.408 bn
7.84%
1 ene 2016 año
81.945 bn
+7.579 bn
10.19%
Ranking de los países por los datos estadísticos actuales

Comentarios:

Enviar
PremiumAbout & FeedbackAcuerdoPrivacidad
logo
© 2022 Selected Technologies LLC – Morgan Hill, California