29
/es/
es
AIzaSyAYiBZKx7MnpbEhh9jyipgxe19OcubqV5w
April 1, 2024
202607
Mozambique
MOZ
true
2
1
Broad money (current LCU)
2016,2015,2014,2013,2012,2011,2010,2009,2008,2007,2006,2005,2004,2003,2002,2001,2000,1999,1998,1997,1996,1995,1994,1993,1992,1991,1990
Download
Estadísticas Globales de la Biblioteca →Mozambique →

Broad money (current LCU)

Estas estadísticas en otros países:
AfghanistanAlbaniaAlgeriaAngolaAntigua and BarbudaArgentinaArmeniaArubaAustraliaAzerbaijanBahamas, TheBahrainBangladeshBarbadosBelarusBelizeBeninBhutanBoliviaBosnia and HerzegovinaBotswanaBrazilBrunei DarussalamBulgariaBurkina FasoBurundiCabo VerdeCambodiaCameroonCanadaCentral African RepublicChadChileChinaColombiaComorosCongo, Dem. Rep.Congo, Rep.Costa RicaCote d'IvoireCroatiaCzech RepublicDenmarkDjiboutiDominicaDominican RepublicEcuadorEgypt, Arab Rep.El SalvadorEquatorial GuineaEritreaEstoniaEthiopiaEuro areaFijiGabonGambia, TheGeorgiaGhanaGrenadaGuatemalaGuineaGuinea-BissauGuyanaHaitiHondurasHong Kong SAR, ChinaHungaryIcelandIndiaIndonesiaIran, Islamic Rep.IraqIsraelJamaicaJapanJordanKazakhstanKenyaKorea, Rep.KuwaitKyrgyz RepublicLao PDRLatviaLebanonLesothoLiberiaLibyaLithuaniaMacao SAR, ChinaMacedonia, FYRMadagascarMalawiMalaysiaMaldivesMaliMauritaniaMauritiusMexicoMicronesia, Fed. Sts.MoldovaMongoliaMoroccoMozambiqueMyanmarNamibiaNepalNew ZealandNicaraguaNigerNigeriaNorwayOmanPakistanPanamaPapua New GuineaParaguayPeruPhilippinesPolandQatarRomaniaRussian FederationRwandaSamoaSao Tome and PrincipeSaudi ArabiaSenegalSerbiaSeychellesSierra LeoneSingaporeSlovak RepublicSolomon IslandsSouth AfricaSouth SudanSri LankaSt. Kitts and NevisSt. LuciaSt. Vincent and the GrenadinesSudanSurinameSwazilandSwedenSwitzerlandSyrian Arab RepublicTajikistanTanzaniaThailandTimor-LesteTogoTongaTrinidad and TobagoTunisiaTurkeyUgandaUkraineUnited Arab EmiratesUnited KingdomUnited StatesUruguayVanuatuVenezuela, RBVietnamWest Bank and GazaYemen, Rep.ZambiaZimbabwe
línea de tiempo (timeline):
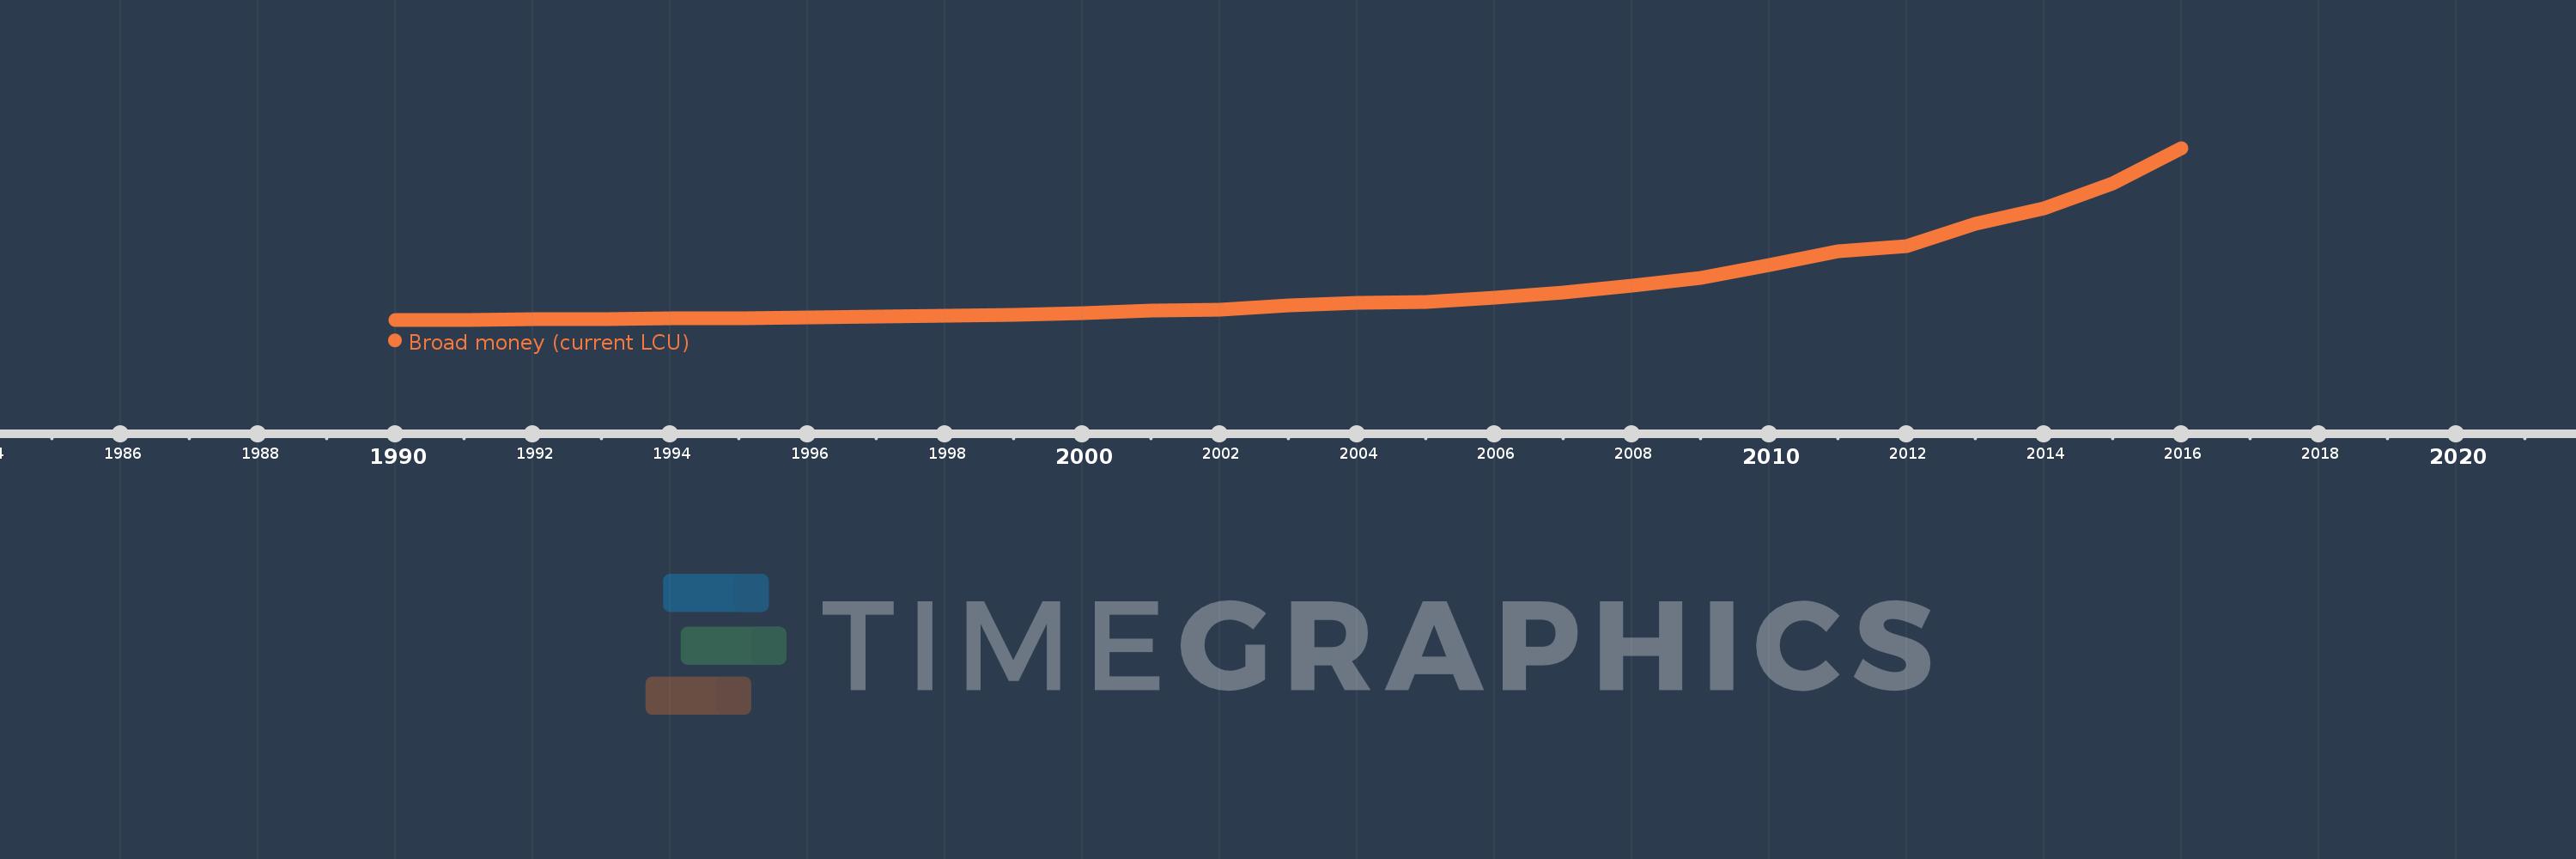
En esta escala de tiempo se presenta un gráfico de 1990 y 2016 de Mozambique. Los datos de 1989 están ausentes. El número de observaciones reales por fecha: 27.
Fuente (nombre):
Indicadores del desarrollo mundial
Fuente (organización):
International Monetary Fund, International Financial Statistics and data files.
Categorías:
Financial Sector
Se ha actualizado:
23 abr 2017 año
Los indicadores de los cambios de valor en los últimos años
En promedio:
67.312 bn
Mínimo:
450.235 millones
1 ene 1990 año
Máximo:
333.465 bn
1 ene 2016 año
A la fecha de observación
Valor
Cambio absoluto
El cambio con respecto al valor anterior
1 ene 1990 año
450.235 millones
+450.235 millones
0.0%
1 ene 1991 año
617.837 millones
+167.602 millones
37.23%
1 ene 1992 año
891.5 millones
+273.663 millones
44.29%
1 ene 1993 año
1.522 bn
+631.0 millones
70.78%
1 ene 1994 año
2.544 bn
+1.021 bn
67.07%
1 ene 1995 año
3.826 bn
+1.283 bn
50.43%
1 ene 1996 año
5.652 bn
+1.825 bn
47.7%
1 ene 1997 año
6.733 bn
+1.081 bn
19.13%
1 ene 1998 año
8.342 bn
+1.609 bn
23.9%
1 ene 1999 año
9.829 bn
+1.487 bn
17.83%
1 ene 2000 año
12.954 bn
+3.125 bn
31.79%
1 ene 2001 año
17.917 bn
+4.964 bn
38.32%
1 ene 2002 año
20.587 bn
+2.669 bn
14.9%
1 ene 2003 año
28.238 bn
+7.651 bn
37.16%
1 ene 2004 año
32.556 bn
+4.319 bn
15.29%
1 ene 2005 año
34.48 bn
+1.924 bn
5.91%
1 ene 2006 año
43.785 bn
+9.304 bn
26.98%
1 ene 2007 año
54.005 bn
+10.22 bn
23.34%
1 ene 2008 año
67.099 bn
+13.095 bn
24.25%
1 ene 2009 año
80.724 bn
+13.624 bn
20.3%
1 ene 2010 año
107.075 bn
+26.351 bn
32.64%
1 ene 2011 año
133.412 bn
+26.337 bn
24.6%
1 ene 2012 año
143.802 bn
+10.39 bn
7.79%
1 ene 2013 año
186.013 bn
+42.211 bn
29.35%
1 ene 2014 año
216.425 bn
+30.412 bn
16.35%
1 ene 2015 año
264.47 bn
+48.045 bn
22.2%
1 ene 2016 año
333.465 bn
+68.995 bn
26.09%
Ranking de los países por los datos estadísticos actuales

Comentarios:

Enviar
PremiumAbout & FeedbackAcuerdoPrivacidad
logo
© 2022 Selected Technologies LLC – Morgan Hill, California