29
/es/
es
AIzaSyAYiBZKx7MnpbEhh9jyipgxe19OcubqV5w
April 1, 2024
114574
Croatia
HRV
true
2
1
Broad money (current LCU)
2016,2015,2014,2013,2012,2011,2010,2009,2008,2007,2006,2005,2004,2003,2002,2001,2000,1999,1998,1997,1996,1995,1994
Download
Estadísticas Globales de la Biblioteca →Croatia →

Broad money (current LCU)

Estas estadísticas en otros países:
AfghanistanAlbaniaAlgeriaAngolaAntigua and BarbudaArgentinaArmeniaArubaAustraliaAzerbaijanBahamas, TheBahrainBangladeshBarbadosBelarusBelizeBeninBhutanBoliviaBosnia and HerzegovinaBotswanaBrazilBrunei DarussalamBulgariaBurkina FasoBurundiCabo VerdeCambodiaCameroonCanadaCentral African RepublicChadChileChinaColombiaComorosCongo, Dem. Rep.Congo, Rep.Costa RicaCote d'IvoireCroatiaCzech RepublicDenmarkDjiboutiDominicaDominican RepublicEcuadorEgypt, Arab Rep.El SalvadorEquatorial GuineaEritreaEstoniaEthiopiaEuro areaFijiGabonGambia, TheGeorgiaGhanaGrenadaGuatemalaGuineaGuinea-BissauGuyanaHaitiHondurasHong Kong SAR, ChinaHungaryIcelandIndiaIndonesiaIran, Islamic Rep.IraqIsraelJamaicaJapanJordanKazakhstanKenyaKorea, Rep.KuwaitKyrgyz RepublicLao PDRLatviaLebanonLesothoLiberiaLibyaLithuaniaMacao SAR, ChinaMacedonia, FYRMadagascarMalawiMalaysiaMaldivesMaliMauritaniaMauritiusMexicoMicronesia, Fed. Sts.MoldovaMongoliaMoroccoMozambiqueMyanmarNamibiaNepalNew ZealandNicaraguaNigerNigeriaNorwayOmanPakistanPanamaPapua New GuineaParaguayPeruPhilippinesPolandQatarRomaniaRussian FederationRwandaSamoaSao Tome and PrincipeSaudi ArabiaSenegalSerbiaSeychellesSierra LeoneSingaporeSlovak RepublicSolomon IslandsSouth AfricaSouth SudanSri LankaSt. Kitts and NevisSt. LuciaSt. Vincent and the GrenadinesSudanSurinameSwazilandSwedenSwitzerlandSyrian Arab RepublicTajikistanTanzaniaThailandTimor-LesteTogoTongaTrinidad and TobagoTunisiaTurkeyUgandaUkraineUnited Arab EmiratesUnited KingdomUnited StatesUruguayVanuatuVenezuela, RBVietnamWest Bank and GazaYemen, Rep.ZambiaZimbabwe
línea de tiempo (timeline):
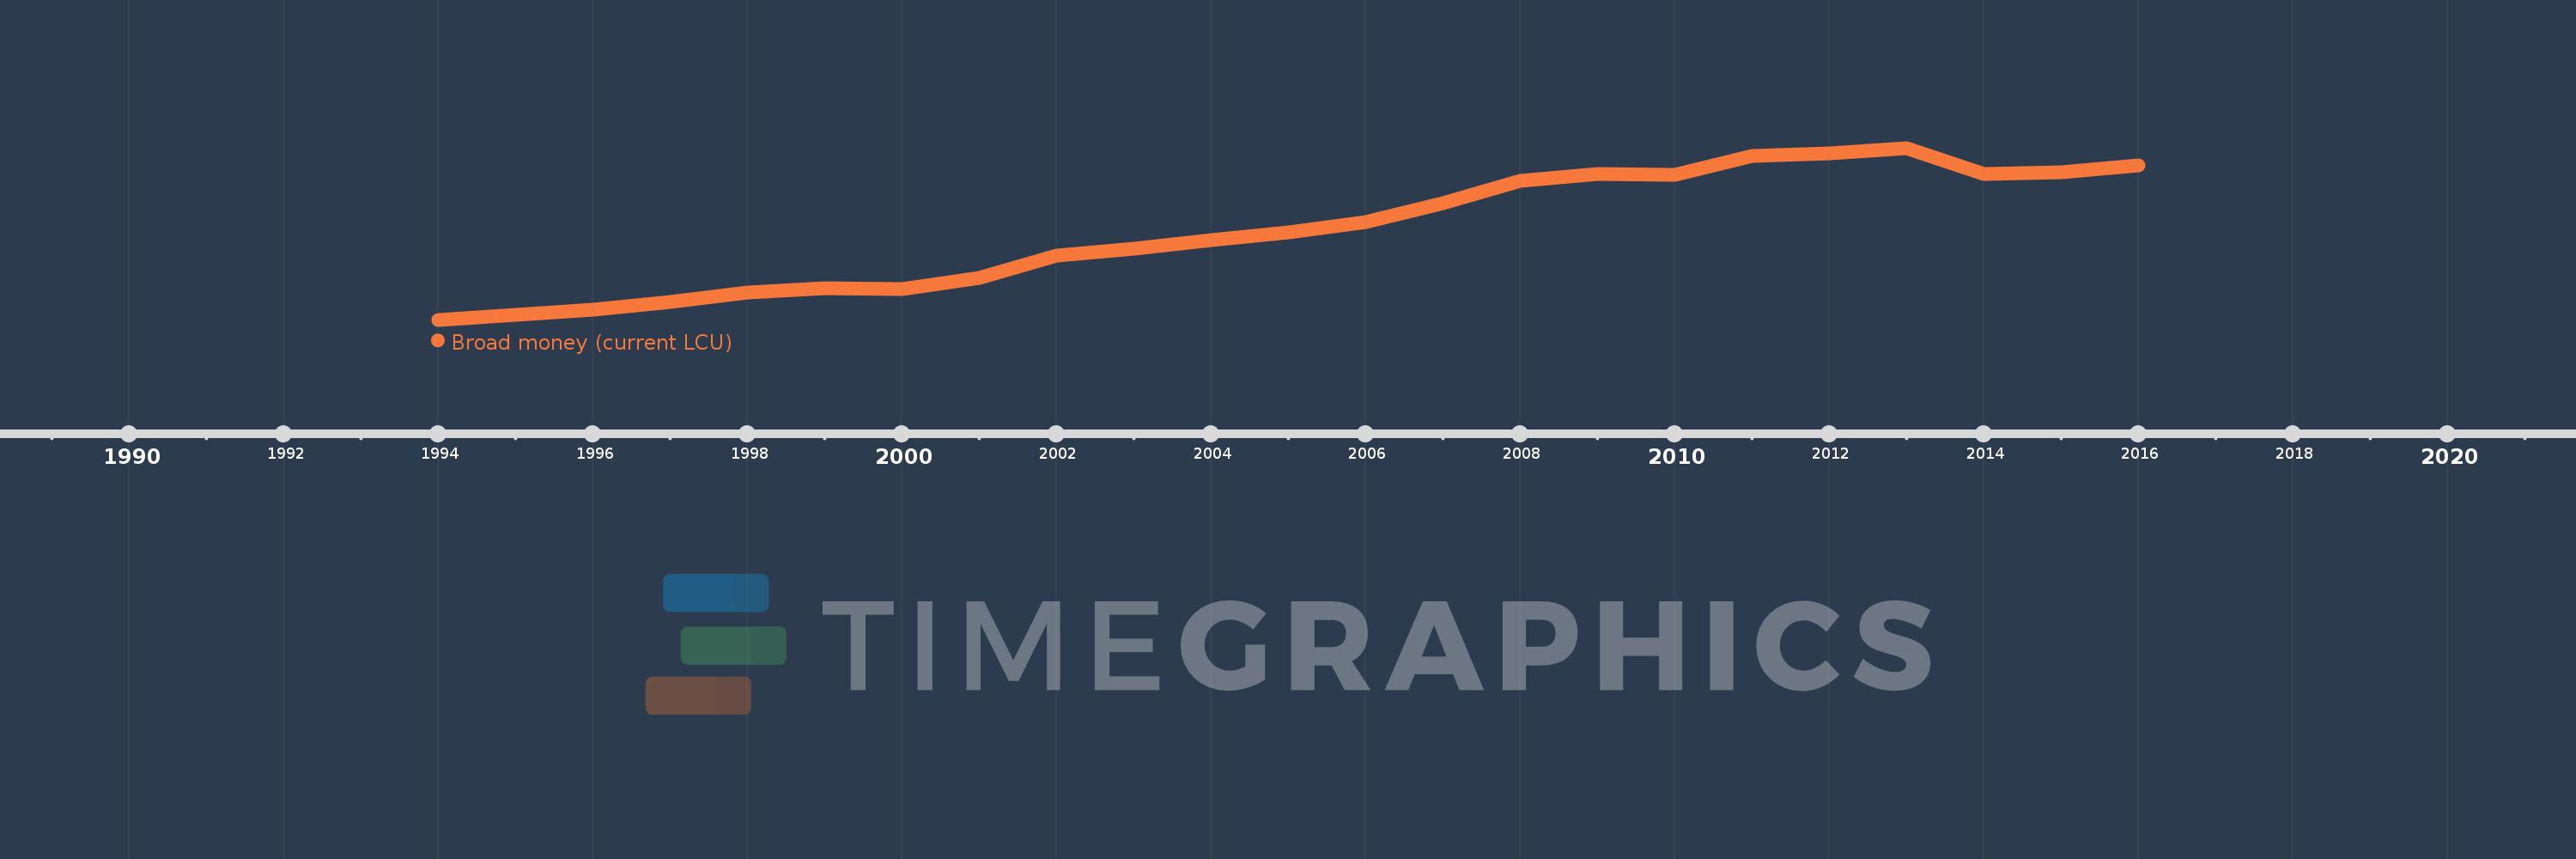
En esta escala de tiempo se presenta un gráfico de 1994 y 2016 de Croatia. Los datos de 1993 están ausentes. El número de observaciones reales por fecha: 23.
Fuente (nombre):
Indicadores del desarrollo mundial
Fuente (organización):
International Monetary Fund, International Financial Statistics and data files.
Categorías:
Financial Sector
Se ha actualizado:
23 abr 2017 año
Los indicadores de los cambios de valor en los últimos años
En promedio:
143.638 bn
Mínimo:
10.012 bn
1 ene 1994 año
Máximo:
266.364 bn
1 ene 2013 año
A la fecha de observación
Valor
Cambio absoluto
El cambio con respecto al valor anterior
1 ene 1994 año
10.012 bn
+10.012 bn
0.0%
1 ene 1995 año
17.478 bn
+7.465 bn
74.56%
1 ene 1996 año
24.541 bn
+7.063 bn
40.41%
1 ene 1997 año
36.624 bn
+12.083 bn
49.24%
1 ene 1998 año
50.691 bn
+14.067 bn
38.41%
1 ene 1999 año
57.276 bn
+6.585 bn
12.99%
1 ene 2000 año
56.222 bn
-1.053 bn
-1.84%
1 ene 2001 año
72.583 bn
+16.36 bn
29.1%
1 ene 2002 año
106.071 bn
+33.488 bn
46.14%
1 ene 2003 año
116.142 bn
+10.07 bn
9.49%
1 ene 2004 año
128.893 bn
+12.751 bn
10.98%
1 ene 2005 año
140.908 bn
+12.015 bn
9.32%
1 ene 2006 año
155.777 bn
+14.869 bn
10.55%
1 ene 2007 año
183.901 bn
+28.123 bn
18.05%
1 ene 2008 año
217.55 bn
+33.649 bn
18.3%
1 ene 2009 año
227.028 bn
+9.478 bn
4.36%
1 ene 2010 año
225.702 bn
-1.326 bn
-0.58%
1 ene 2011 año
254.206 bn
+28.504 bn
12.63%
1 ene 2012 año
258.146 bn
+3.941 bn
1.55%
1 ene 2013 año
266.364 bn
+8.218 bn
3.18%
1 ene 2014 año
227.575 bn
-38.789 bn
-14.56%
1 ene 2015 año
229.602 bn
+2.027 bn
0.89%
1 ene 2016 año
240.379 bn
+10.777 bn
4.69%
Ranking de los países por los datos estadísticos actuales

Comentarios:

Enviar
PremiumAbout & FeedbackAcuerdoPrivacidad
logo
© 2022 Selected Technologies LLC – Morgan Hill, California