29
/es/
es
AIzaSyAYiBZKx7MnpbEhh9jyipgxe19OcubqV5w
April 1, 2024
151364
Hong Kong SAR, China
HKG
true
2
1
Broad money (current LCU)
2016,2015,2014,2013,2012,2011,2010,2009,2008,2007,2006,2005,2004,2003,2002,2001,2000,1999,1998,1997,1996,1995,1994,1993,1992
Download
Estadísticas Globales de la Biblioteca →Hong Kong SAR, China →

Broad money (current LCU)

Estas estadísticas en otros países:
AfghanistanAlbaniaAlgeriaAngolaAntigua and BarbudaArgentinaArmeniaArubaAustraliaAzerbaijanBahamas, TheBahrainBangladeshBarbadosBelarusBelizeBeninBhutanBoliviaBosnia and HerzegovinaBotswanaBrazilBrunei DarussalamBulgariaBurkina FasoBurundiCabo VerdeCambodiaCameroonCanadaCentral African RepublicChadChileChinaColombiaComorosCongo, Dem. Rep.Congo, Rep.Costa RicaCote d'IvoireCroatiaCzech RepublicDenmarkDjiboutiDominicaDominican RepublicEcuadorEgypt, Arab Rep.El SalvadorEquatorial GuineaEritreaEstoniaEthiopiaEuro areaFijiGabonGambia, TheGeorgiaGhanaGrenadaGuatemalaGuineaGuinea-BissauGuyanaHaitiHondurasHong Kong SAR, ChinaHungaryIcelandIndiaIndonesiaIran, Islamic Rep.IraqIsraelJamaicaJapanJordanKazakhstanKenyaKorea, Rep.KuwaitKyrgyz RepublicLao PDRLatviaLebanonLesothoLiberiaLibyaLithuaniaMacao SAR, ChinaMacedonia, FYRMadagascarMalawiMalaysiaMaldivesMaliMauritaniaMauritiusMexicoMicronesia, Fed. Sts.MoldovaMongoliaMoroccoMozambiqueMyanmarNamibiaNepalNew ZealandNicaraguaNigerNigeriaNorwayOmanPakistanPanamaPapua New GuineaParaguayPeruPhilippinesPolandQatarRomaniaRussian FederationRwandaSamoaSao Tome and PrincipeSaudi ArabiaSenegalSerbiaSeychellesSierra LeoneSingaporeSlovak RepublicSolomon IslandsSouth AfricaSouth SudanSri LankaSt. Kitts and NevisSt. LuciaSt. Vincent and the GrenadinesSudanSurinameSwazilandSwedenSwitzerlandSyrian Arab RepublicTajikistanTanzaniaThailandTimor-LesteTogoTongaTrinidad and TobagoTunisiaTurkeyUgandaUkraineUnited Arab EmiratesUnited KingdomUnited StatesUruguayVanuatuVenezuela, RBVietnamWest Bank and GazaYemen, Rep.ZambiaZimbabwe
línea de tiempo (timeline):
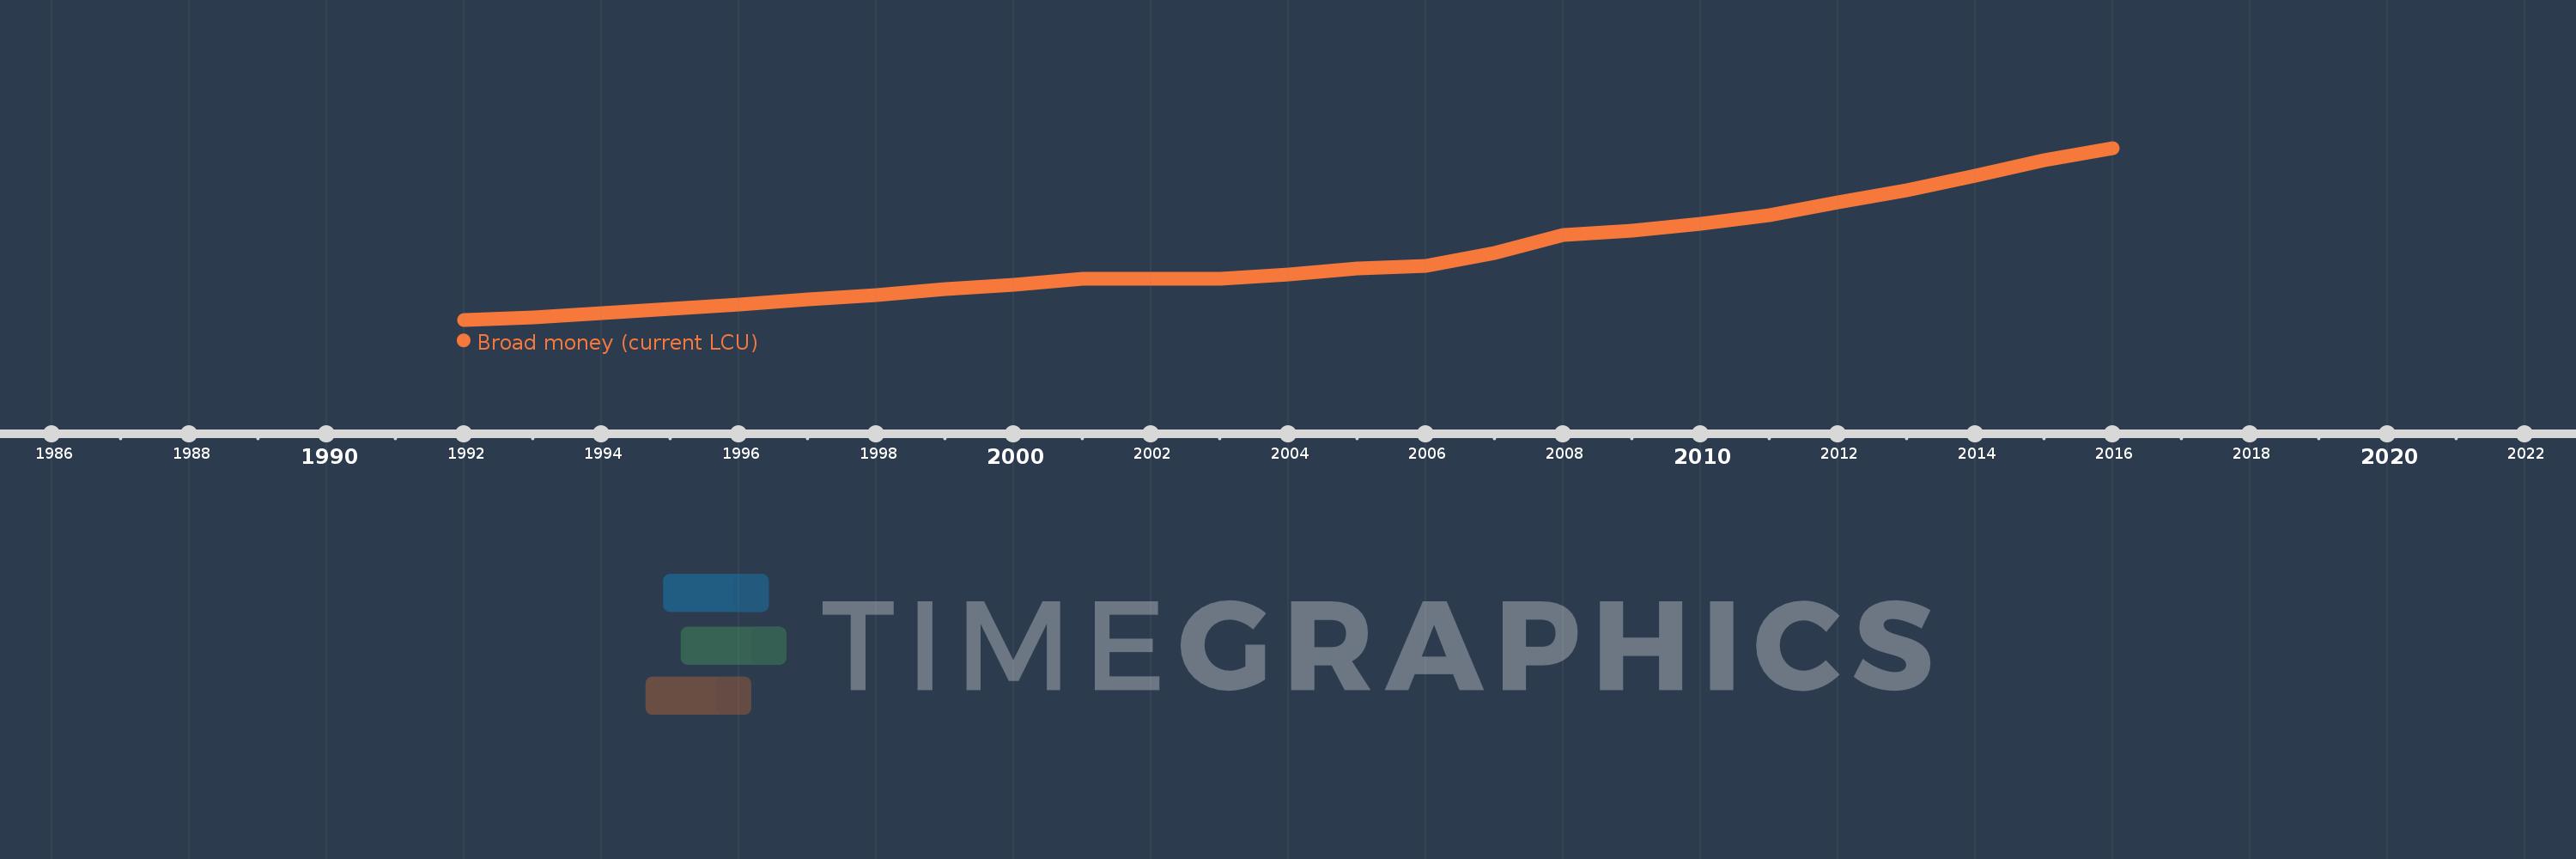
En esta escala de tiempo se presenta un gráfico de 1992 y 2016 de Hong Kong SAR, China. Los datos de 1991 están ausentes. El número de observaciones reales por fecha: 25.
Fuente (nombre):
Indicadores del desarrollo mundial
Fuente (organización):
International Monetary Fund, International Financial Statistics and data files.
Categorías:
Financial Sector
Se ha actualizado:
23 abr 2017 año
Los indicadores de los cambios de valor en los últimos años
En promedio:
3.973 billones
Mínimo:
1.215 billones
1 ene 1992 año
Máximo:
8.703 billones
1 ene 2016 año
A la fecha de observación
Valor
Cambio absoluto
El cambio con respecto al valor anterior
1 ene 1992 año
1.215 billones
+1.215 billones
0.0%
1 ene 1993 año
1.318 billones
+103.056 bn
8.48%
1 ene 1994 año
1.508 billones
+190.512 bn
14.46%
1 ene 1995 año
1.686 billones
+177.058 bn
11.74%
1 ene 1996 año
1.865 billones
+179.479 bn
10.65%
1 ene 1997 año
2.098 billones
+232.947 bn
12.49%
1 ene 1998 año
2.281 billones
+182.889 bn
8.72%
1 ene 1999 año
2.535 billones
+253.806 bn
11.13%
1 ene 2000 año
2.745 billones
+210.443 bn
8.3%
1 ene 2001 año
3.001 billones
+256.067 bn
9.33%
1 ene 2002 año
2.993 billones
-8.312 bn
-0.28%
1 ene 2003 año
3.009 billones
+16.45 bn
0.55%
1 ene 2004 año
3.198 billones
+188.88 bn
6.28%
1 ene 2005 año
3.433 billones
+234.678 bn
7.34%
1 ene 2006 año
3.555 billones
+121.677 bn
3.54%
1 ene 2007 año
4.131 billones
+576.715 bn
16.22%
1 ene 2008 año
4.909 billones
+777.429 bn
18.82%
1 ene 2009 año
5.116 billones
+207.045 bn
4.22%
1 ene 2010 año
5.383 billones
+267.498 bn
5.23%
1 ene 2011 año
5.781 billones
+397.361 bn
7.38%
1 ene 2012 año
6.349 billones
+568.863 bn
9.84%
1 ene 2013 año
6.846 billones
+496.441 bn
7.82%
1 ene 2014 año
7.496 billones
+650.342 bn
9.5%
1 ene 2015 año
8.166 billones
+670.106 bn
8.94%
1 ene 2016 año
8.703 billones
+536.614 bn
6.57%
Ranking de los países por los datos estadísticos actuales

Comentarios:

Enviar
PremiumAbout & FeedbackAcuerdoPrivacidad
logo
© 2022 Selected Technologies LLC – Morgan Hill, California