33
/es/
AIzaSyB4mHJ5NPEv-XzF7P6NDYXjlkCWaeKw5bc
November 30, 2025
192931
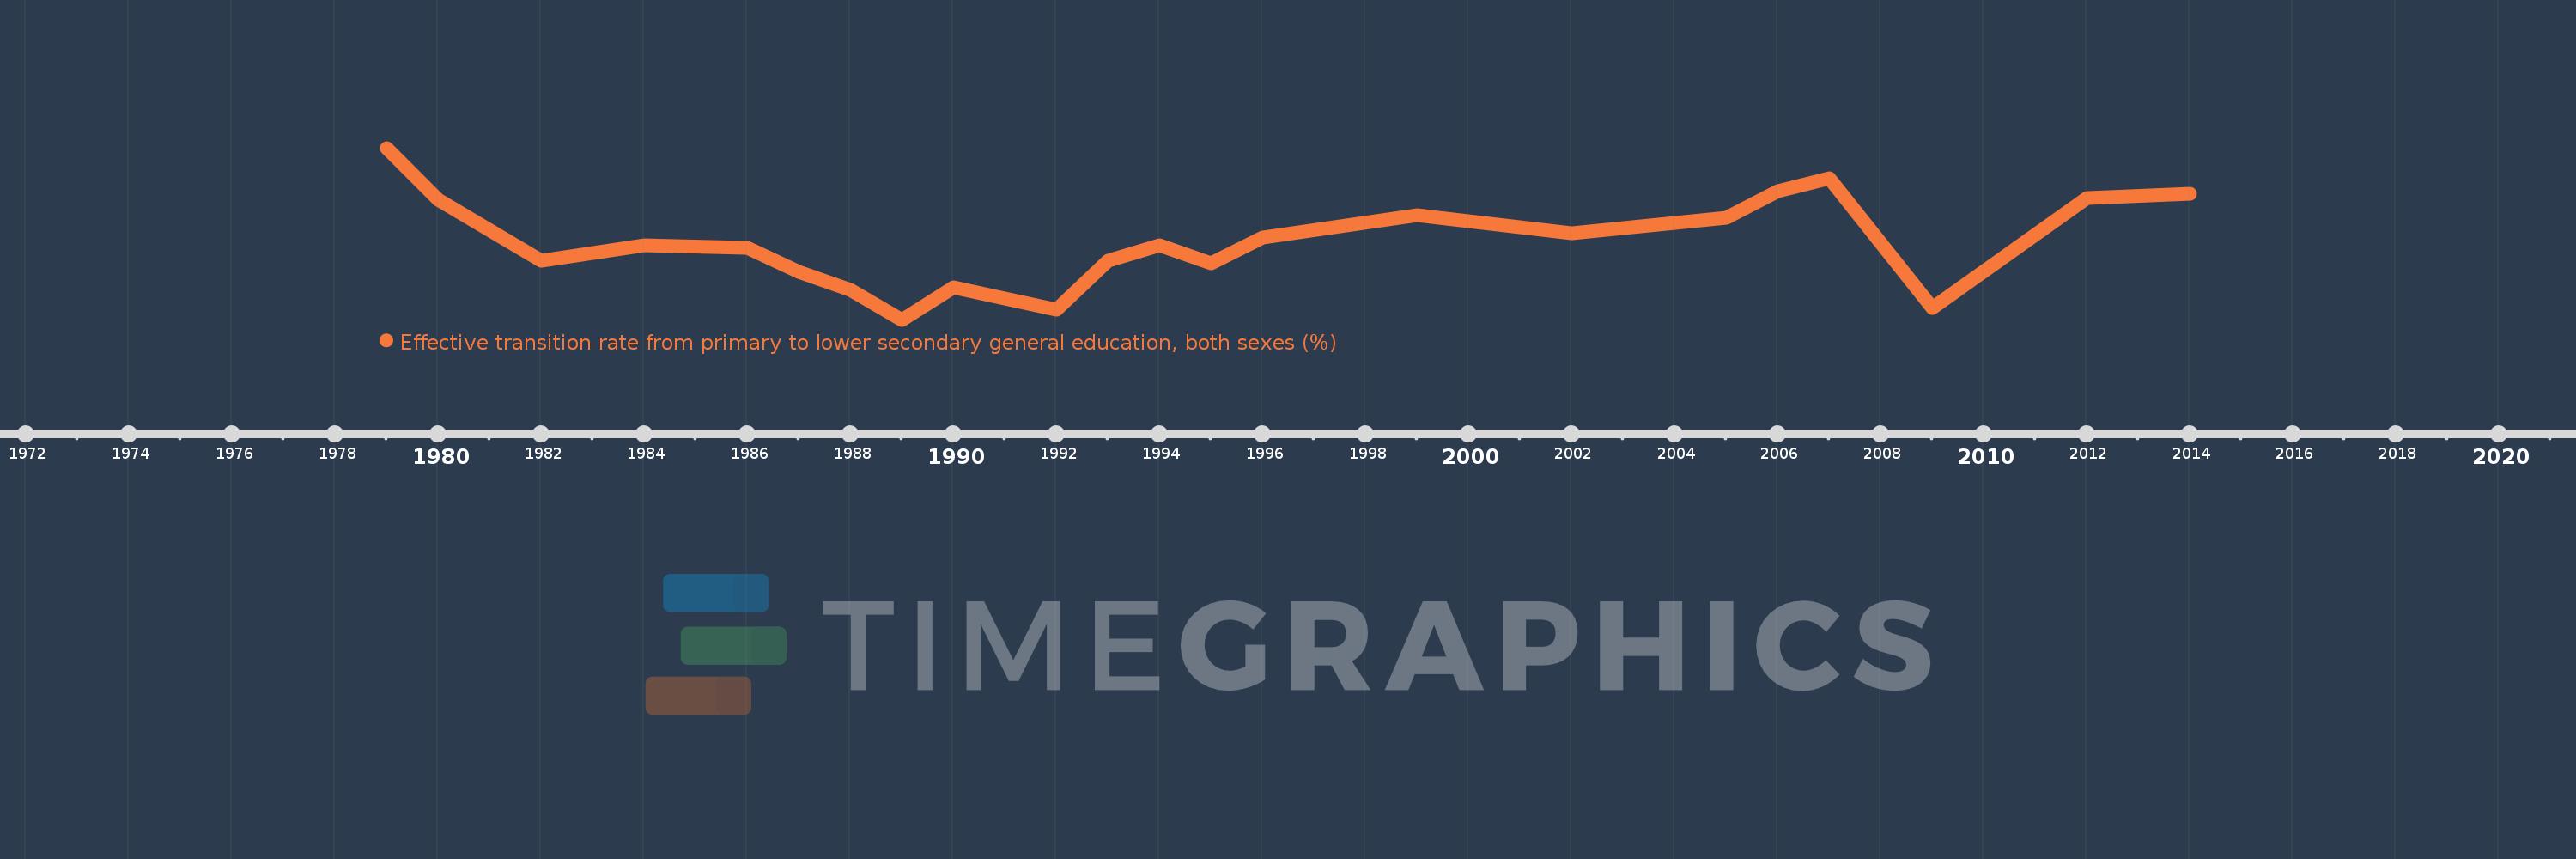
Mauritania
MRT
true
2
1
Effective transition rate from primary to lower secondary general education, both sexes (%)
2014,2012,2009,2007,2006,2005,2002,1999,1996,1995,1994,1993,1992,1990,1989,1988,1987,1986,1984,1982,1980,1979