33
/es/
AIzaSyB4mHJ5NPEv-XzF7P6NDYXjlkCWaeKw5bc
November 1, 2025
151470
Hong Kong SAR, China
HKG
true
2
1
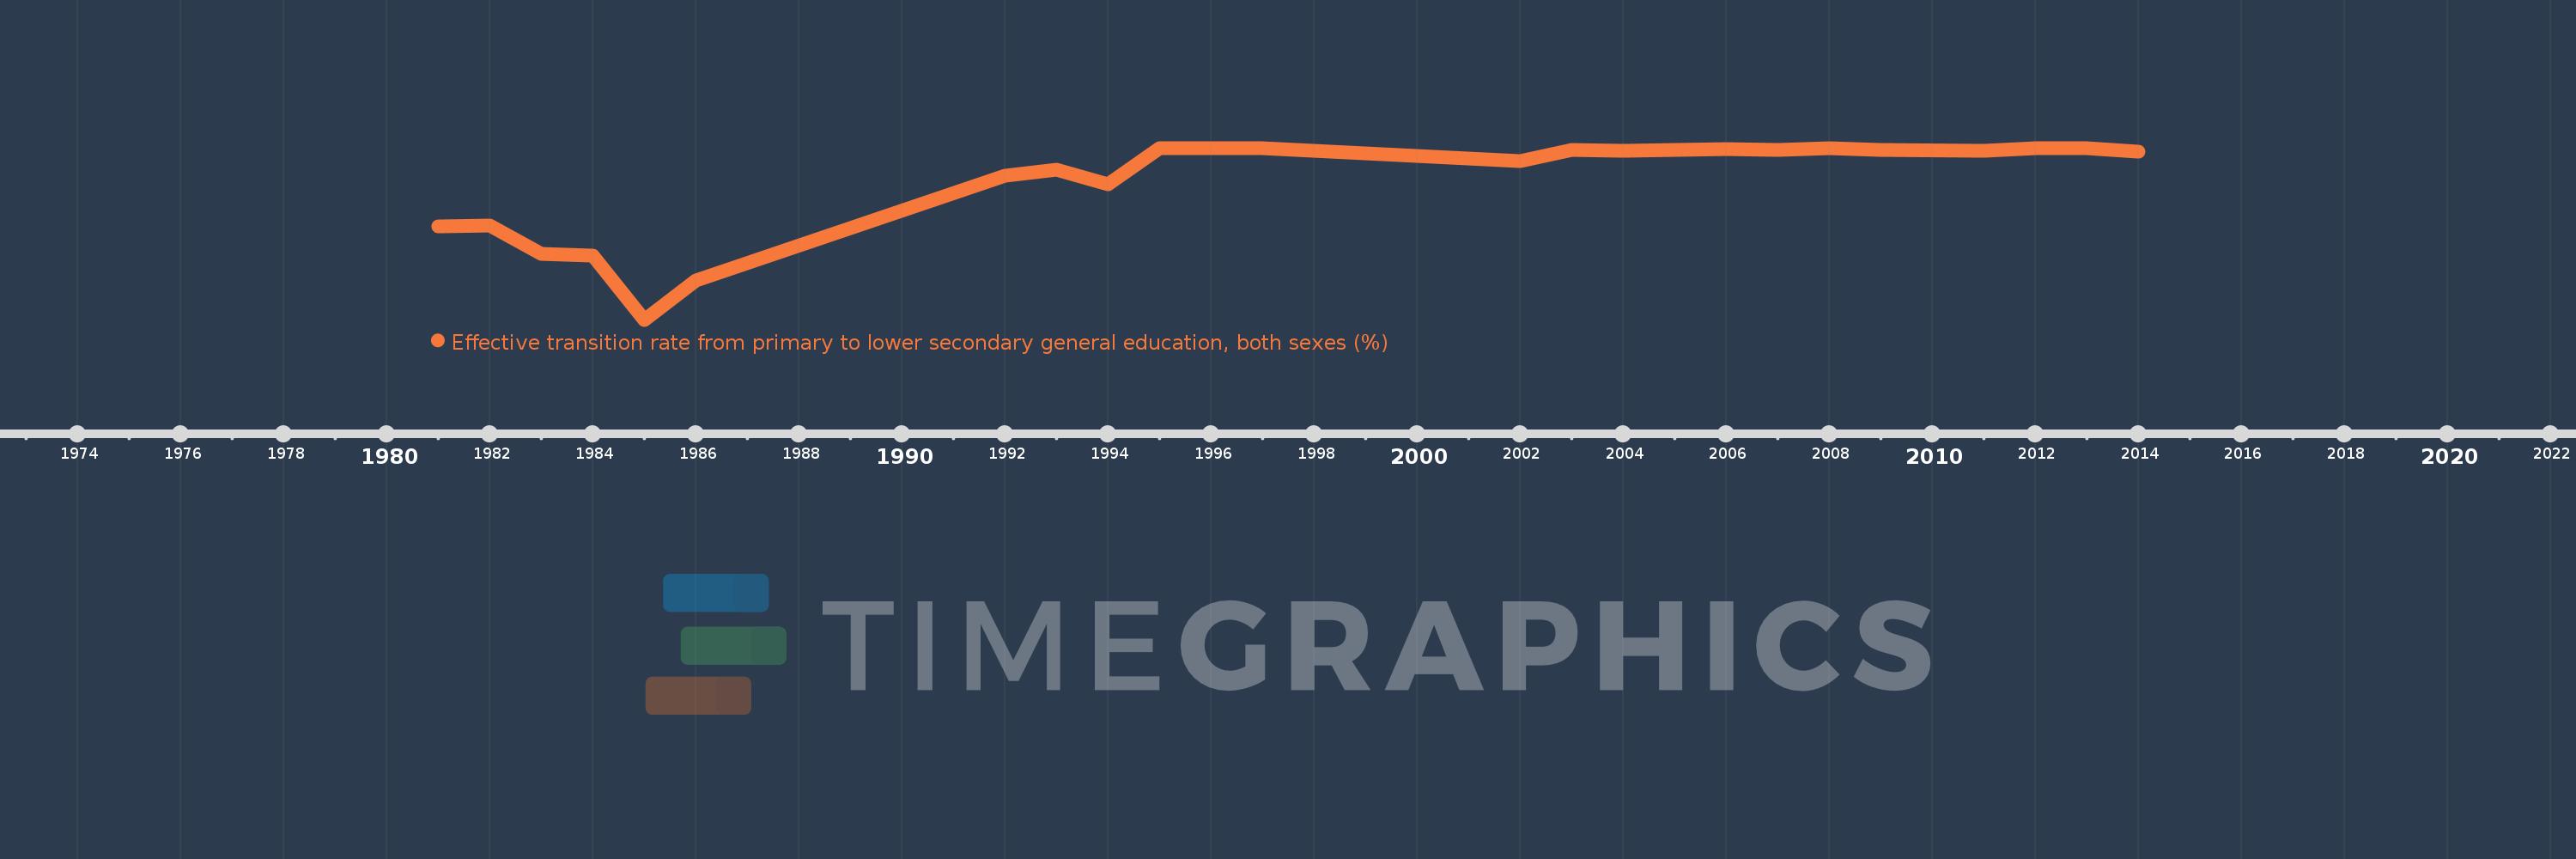
Effective transition rate from primary to lower secondary general education, both sexes (%)
2014,2013,2012,2011,2009,2008,2007,2006,2005,2004,2003,2002,1997,1996,1995,1994,1993,1992,1986,1985,1984,1983,1982,1981