30
/de/
AIzaSyAYiBZKx7MnpbEhh9jyipgxe19OcubqV5w
April 1, 2024
77425
Bahrain
BHR
true
2
1
Net incurrence of liabilities, total (% of GDP)
2014,2012,2011,2010,2009,2008,2007,2006,2005,2004,2003,2002,2001,2000,1999,1998,1997,1996,1995,1994,1993,1992,1991
Download
Bibliothek der Globalstatistik →Bahrain →

Net incurrence of liabilities, total (% of GDP)

Diese Statistik in anderen Ländern:

AfghanistanAlbaniaAlgeriaAngolaAntigua and BarbudaArmeniaAustraliaAustriaAzerbaijanBahamas, TheBahrainBangladeshBarbadosBelarusBelgiumBelizeBeninBhutanBoliviaBosnia and HerzegovinaBrazilBurkina FasoBurundiCabo VerdeCambodiaCanadaCentral African RepublicCentral Europe and the BalticsChileChinaColombiaCongo, Dem. Rep.Congo, Rep.Cote d'IvoireCroatiaCyprusCzech RepublicDominicaDominican RepublicEast Asia & Pacific (excluding high income)East Asia & Pacific (IDA & IBRD countries)Egypt, Arab Rep.El SalvadorEquatorial GuineaEstoniaEthiopiaEuro areaEurope & Central AsiaEurope & Central Asia (excluding high income)Europe & Central Asia (IDA & IBRD countries)European UnionFijiFinlandFranceGeorgiaGermanyGhanaGreeceGuatemalaHigh incomeHondurasHong Kong SAR, ChinaHungaryIBRD onlyIcelandIDA & IBRD totalIndiaIndonesiaIran, Islamic Rep.IraqIrelandIsraelItalyJamaicaJapanJordanKazakhstanKiribatiKorea, Rep.Kyrgyz RepublicLao PDRLate-demographic dividendLebanonLesothoLithuaniaLow & middle incomeLow incomeLower middle incomeLuxembourgMacedonia, FYRMadagascarMalawiMalaysiaMaldivesMaliMaltaMauritiusMicronesia, Fed. Sts.Middle East & North Africa (excluding high income)Middle East & North Africa (IDA & IBRD countries)Middle incomeMoldovaMongoliaMoroccoMozambiqueNamibiaNepalNetherlandsNew ZealandNigeriaNorth AmericaNorwayOECD membersOmanPacific island small statesParaguayPeruPhilippinesPolandPortugalPost-demographic dividendRomaniaRussian FederationRwandaSamoaSan MarinoSao Tome and PrincipeSenegalSerbiaSeychellesSierra LeoneSingaporeSlovak RepublicSolomon IslandsSouth AfricaSouth AsiaSouth Asia (IDA & IBRD)SpainSri LankaSt. Kitts and NevisSub-Saharan Africa Sub-Saharan Africa (excluding high income)Sub-Saharan Africa (IDA & IBRD countries)SurinameSwazilandSwedenSwitzerlandSyrian Arab RepublicTanzaniaThailandTogoTrinidad and TobagoTurkeyUgandaUkraineUnited Arab EmiratesUnited KingdomUnited StatesUpper middle incomeUruguayVanuatuVietnamWest Bank and GazaZimbabwe

Zeitlinie:

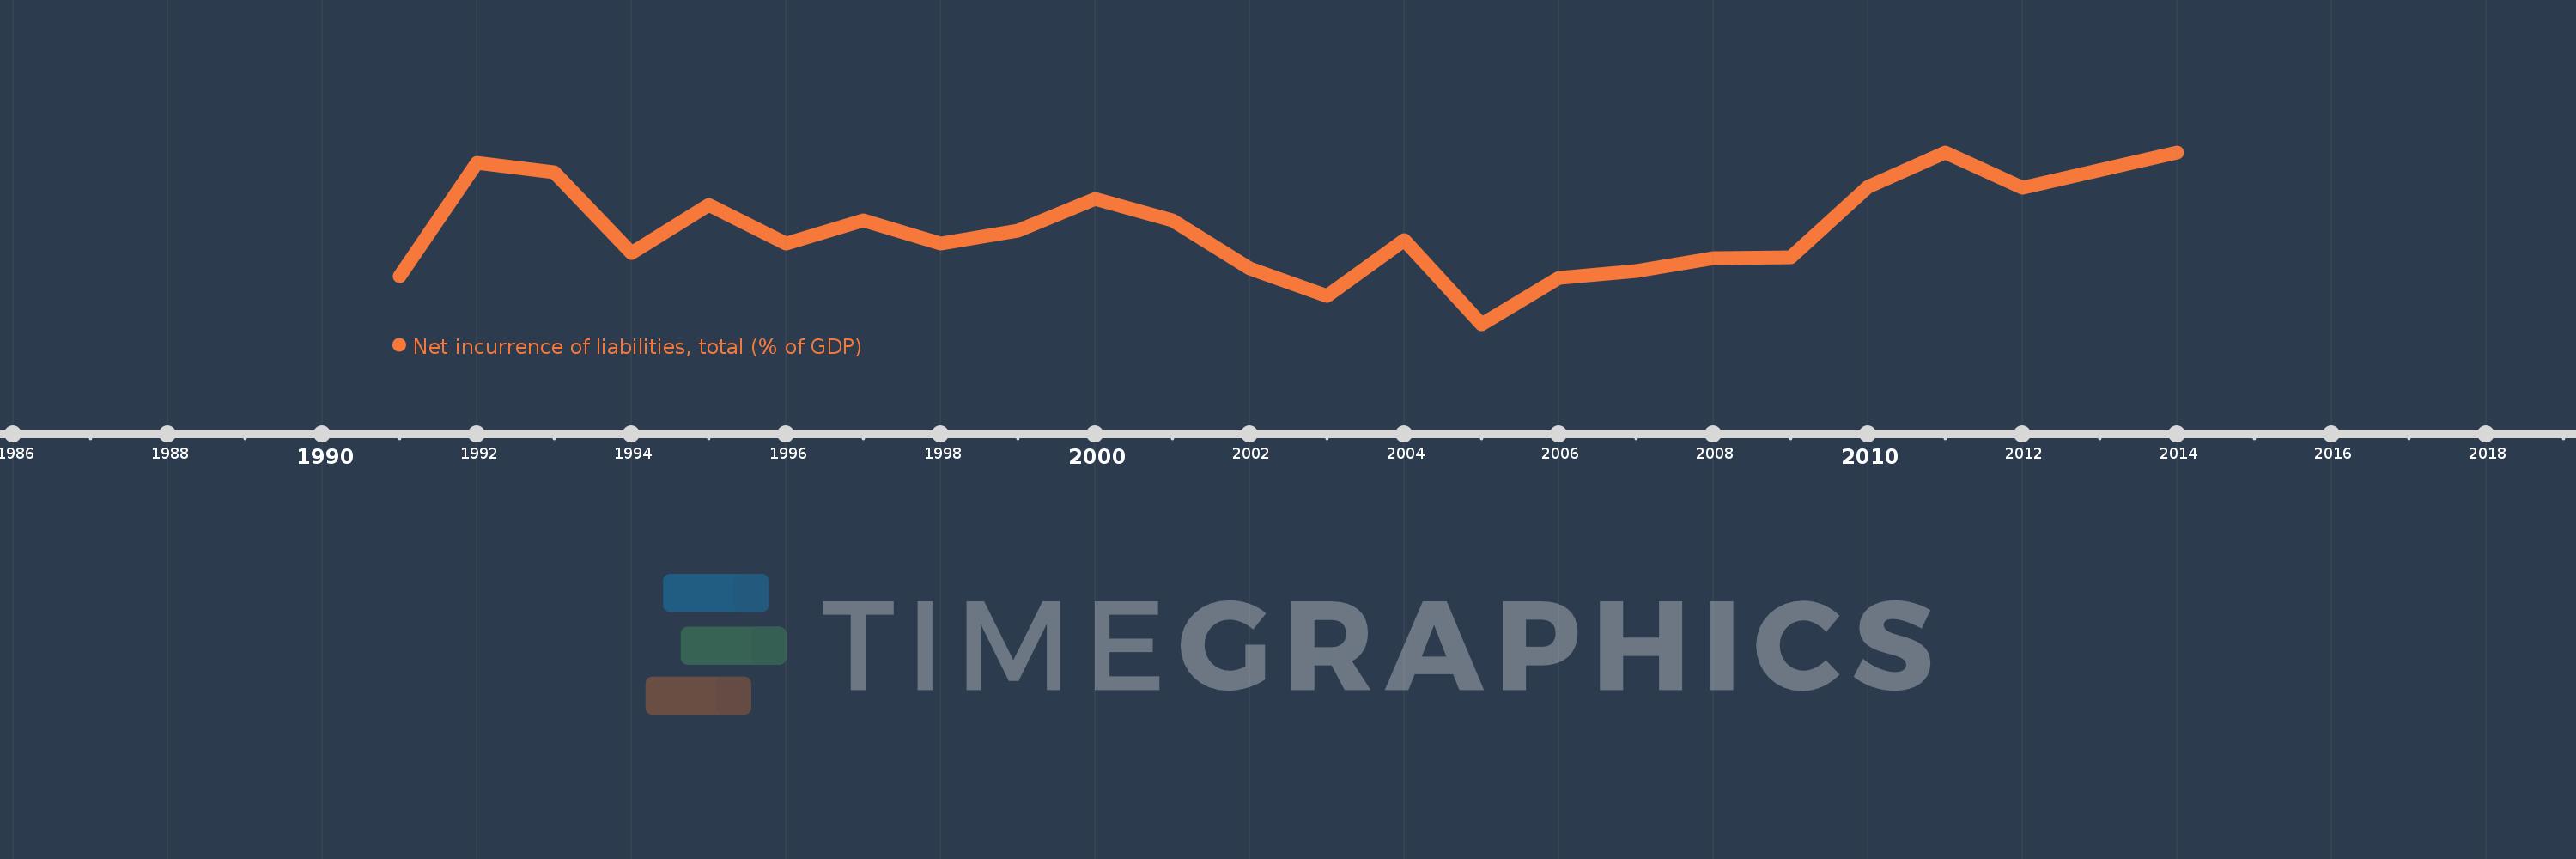
Diese Zeitleiste vorliegt die Graphik ab 1991 J. bis 2014 J. Bahrain. Die Angaben bis 1990 J. sind nicht vorhanden. Die Zahl aktueller Beobachtungen nach Daten: 23.

Die Quelle (Bezeichnung):

Kennzahlen der Weltentwicklung

Die Quelle (Einrichtung):

International Monetary Fund, Government Finance Statistics Yearbook and data files.

Kategorien:

Public Sector

Es wurde aktualisiert:

23 Apr 2017 Jahr

Kennzahlen der Wertänderungen vom Jahr zum Jahr

im Durchschnitt:
4.006
Minimum:
-3.881
1 Jan 2005 Jahr
Maximum:
10.571
1 Jan 2014 Jahr
Zum Datum der Beobachtung
Wert
Absolute Veränderung
Die Veränderung bezüglich dem vorherigen Wert
1 Jan 1991 Jahr
0.176
+0.176
0.0%
1 Jan 1992 Jahr
9.673
+9.497
5.39 Tsnd.%
1 Jan 1993 Jahr
8.895
-0.778
-8.05%
1 Jan 1994 Jahr
2.107
-6.788
-76.31%
1 Jan 1995 Jahr
6.172
+4.065
192.9%
1 Jan 1996 Jahr
2.887
-3.285
-53.22%
1 Jan 1997 Jahr
4.825
+1.938
67.12%
1 Jan 1998 Jahr
2.882
-1.943
-40.27%
1 Jan 1999 Jahr
3.974
+1.092
37.9%
1 Jan 2000 Jahr
6.644
+2.67
67.18%
1 Jan 2001 Jahr
4.854
-1.79
-26.94%
1 Jan 2002 Jahr
0.797
-4.057
-83.58%
1 Jan 2003 Jahr
-1.508
-2.305
-289.15%
1 Jan 2004 Jahr
3.216
+4.723
-313.29%
1 Jan 2005 Jahr
-3.881
-7.097
-220.7%
1 Jan 2006 Jahr
-0.004
+3.877
-99.89%
1 Jan 2007 Jahr
0.626
+0.63
-14.55 Tsnd.%
1 Jan 2008 Jahr
1.651
+1.026
163.85%
1 Jan 2009 Jahr
1.722
+0.071
4.28%
1 Jan 2010 Jahr
7.7
+5.978
347.12%
1 Jan 2011 Jahr
10.562
+2.862
37.17%
1 Jan 2012 Jahr
7.586
-2.976
-28.17%
1 Jan 2014 Jahr
10.571
+2.985
39.35%

Bewertung der Länder gemäß mit laufender Statistik nach Jahren