33
/de/
AIzaSyAYiBZKx7MnpbEhh9jyipgxe19OcubqV5w
August 1, 2025
130845
Ethiopia
ETH
true
2
1
Net incurrence of liabilities, total (% of GDP)
2012,2011,2010,2009,2008,2007,2006,2005,2004,2003,2002,2000,1999,1998,1997,1996,1995,1994,1993,1992,1991
Download
Bibliothek der Globalstatistik →Ethiopia →

Net incurrence of liabilities, total (% of GDP)

Diese Statistik in anderen Ländern:

AfghanistanAlbaniaAlgeriaAngolaAntigua and BarbudaArmeniaAustraliaAustriaAzerbaijanBahamas, TheBahrainBangladeshBarbadosBelarusBelgiumBelizeBeninBhutanBoliviaBosnia and HerzegovinaBrazilBurkina FasoBurundiCabo VerdeCambodiaCanadaCentral African RepublicCentral Europe and the BalticsChileChinaColombiaCongo, Dem. Rep.Congo, Rep.Cote d'IvoireCroatiaCyprusCzech RepublicDominicaDominican RepublicEast Asia & Pacific (excluding high income)East Asia & Pacific (IDA & IBRD countries)Egypt, Arab Rep.El SalvadorEquatorial GuineaEstoniaEthiopiaEuro areaEurope & Central AsiaEurope & Central Asia (excluding high income)Europe & Central Asia (IDA & IBRD countries)European UnionFijiFinlandFranceGeorgiaGermanyGhanaGreeceGuatemalaHigh incomeHondurasHong Kong SAR, ChinaHungaryIBRD onlyIcelandIDA & IBRD totalIndiaIndonesiaIran, Islamic Rep.IraqIrelandIsraelItalyJamaicaJapanJordanKazakhstanKiribatiKorea, Rep.Kyrgyz RepublicLao PDRLate-demographic dividendLebanonLesothoLithuaniaLow & middle incomeLow incomeLower middle incomeLuxembourgMacedonia, FYRMadagascarMalawiMalaysiaMaldivesMaliMaltaMauritiusMicronesia, Fed. Sts.Middle East & North Africa (excluding high income)Middle East & North Africa (IDA & IBRD countries)Middle incomeMoldovaMongoliaMoroccoMozambiqueNamibiaNepalNetherlandsNew ZealandNigeriaNorth AmericaNorwayOECD membersOmanPacific island small statesParaguayPeruPhilippinesPolandPortugalPost-demographic dividendRomaniaRussian FederationRwandaSamoaSan MarinoSao Tome and PrincipeSenegalSerbiaSeychellesSierra LeoneSingaporeSlovak RepublicSolomon IslandsSouth AfricaSouth AsiaSouth Asia (IDA & IBRD)SpainSri LankaSt. Kitts and NevisSub-Saharan Africa Sub-Saharan Africa (excluding high income)Sub-Saharan Africa (IDA & IBRD countries)SurinameSwazilandSwedenSwitzerlandSyrian Arab RepublicTanzaniaThailandTogoTrinidad and TobagoTurkeyUgandaUkraineUnited Arab EmiratesUnited KingdomUnited StatesUpper middle incomeUruguayVanuatuVietnamWest Bank and GazaZimbabwe

Zeitlinie:

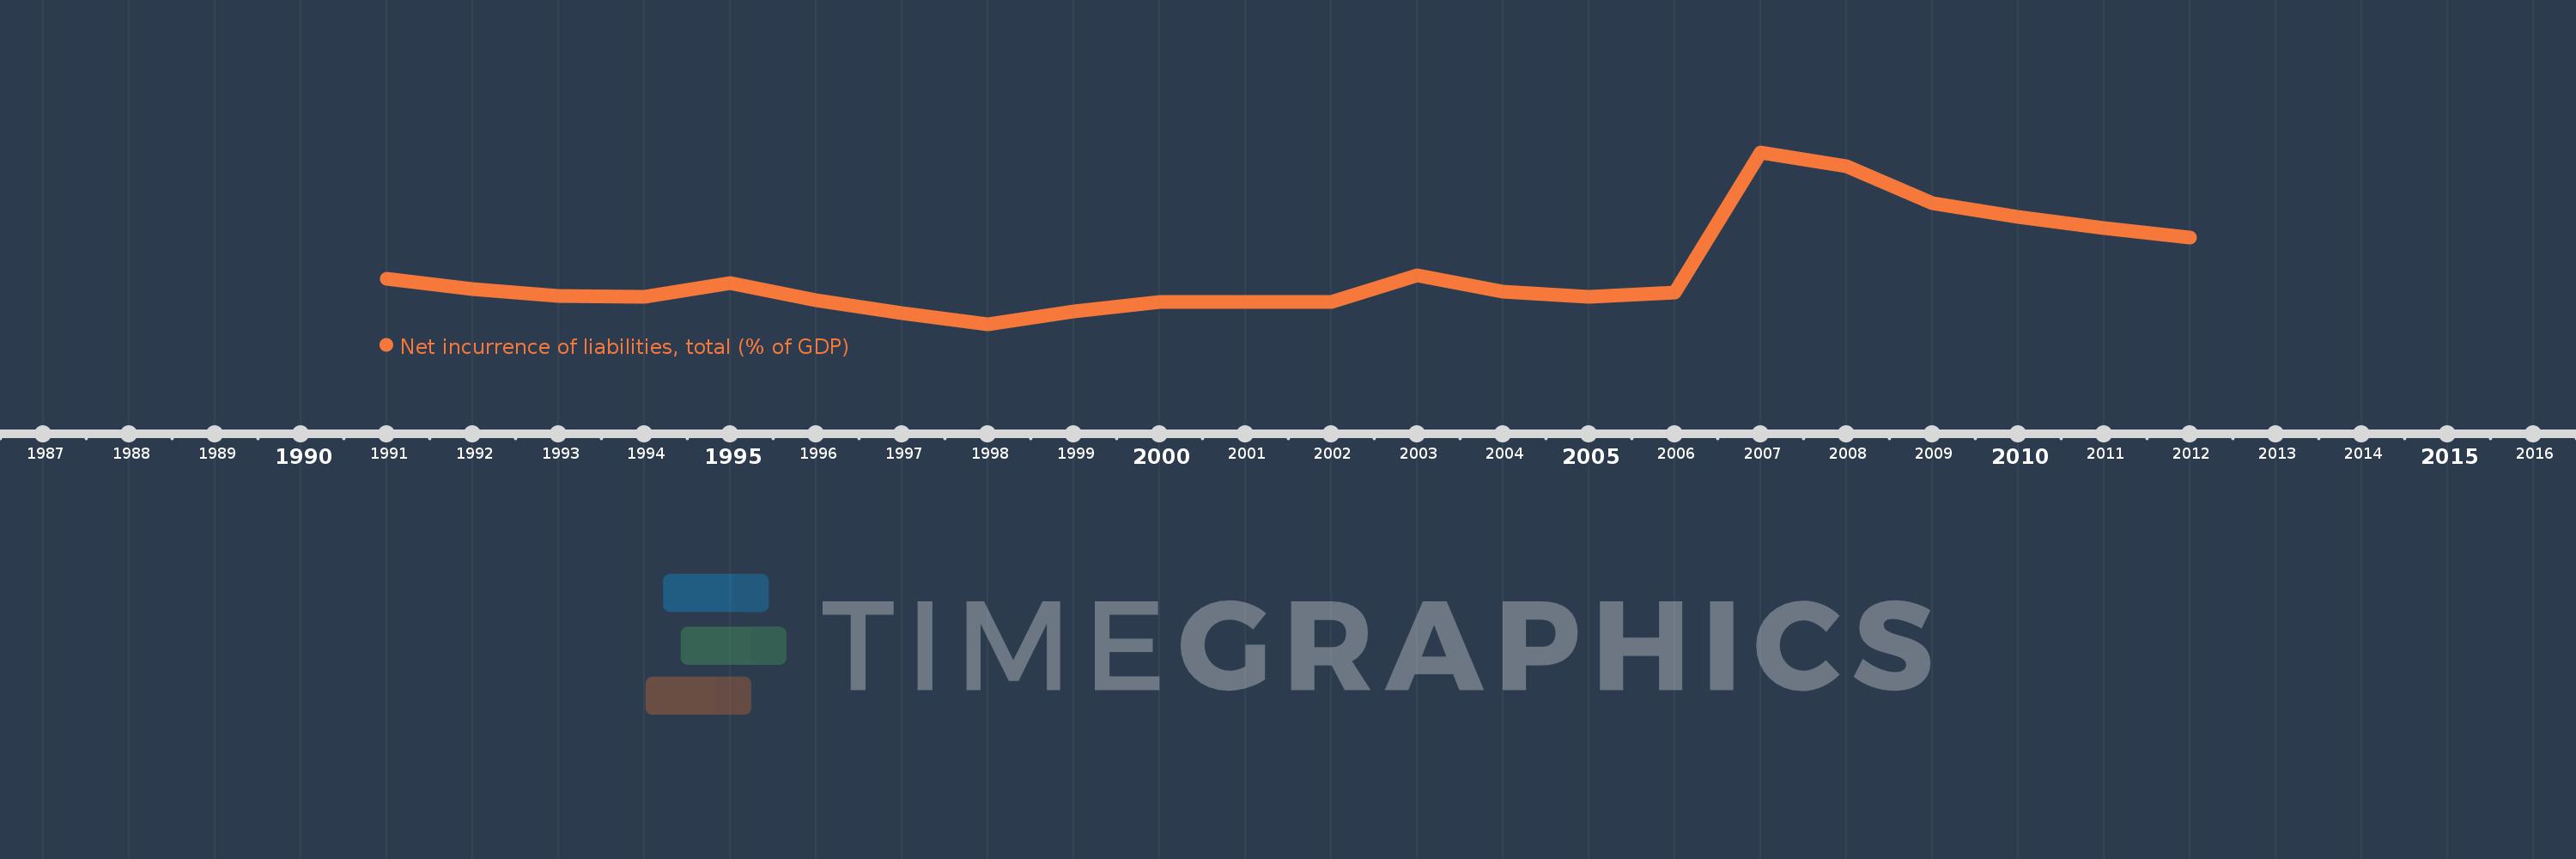
Diese Zeitleiste vorliegt die Graphik ab 1991 J. bis 2012 J. Ethiopia. Die Angaben bis 1990 J. sind nicht vorhanden. Die Zahl aktueller Beobachtungen nach Daten: 21.

Die Quelle (Bezeichnung):

Kennzahlen der Weltentwicklung

Die Quelle (Einrichtung):

International Monetary Fund, Government Finance Statistics Yearbook and data files.

Kategorien:

Public Sector

Es wurde aktualisiert:

23 Apr 2017 Jahr

Kennzahlen der Wertänderungen vom Jahr zum Jahr

im Durchschnitt:
8.193
Minimum:
1.475
1 Jan 1998 Jahr
Maximum:
22.508
1 Jan 2007 Jahr
Zum Datum der Beobachtung
Wert
Absolute Veränderung
Die Veränderung bezüglich dem vorherigen Wert
1 Jan 1991 Jahr
6.992
+6.992
0.0%
1 Jan 1992 Jahr
5.785
-1.206
-17.25%
1 Jan 1993 Jahr
4.969
-0.816
-14.11%
1 Jan 1994 Jahr
4.845
-0.124
-2.5%
1 Jan 1995 Jahr
6.526
+1.682
34.71%
1 Jan 1996 Jahr
4.435
-2.092
-32.05%
1 Jan 1997 Jahr
2.861
-1.574
-35.49%
1 Jan 1998 Jahr
1.475
-1.386
-48.43%
1 Jan 1999 Jahr
3.051
+1.576
106.82%
1 Jan 2000 Jahr
4.202
+1.151
37.71%
1 Jan 2002 Jahr
4.202
+0.0
0.0%
1 Jan 2003 Jahr
7.459
+3.257
77.51%
1 Jan 2004 Jahr
5.432
-2.027
-27.17%
1 Jan 2005 Jahr
4.841
-0.591
-10.89%
1 Jan 2006 Jahr
5.325
+0.484
10.0%
1 Jan 2007 Jahr
22.508
+17.183
322.67%
1 Jan 2008 Jahr
20.833
-1.675
-7.44%
1 Jan 2009 Jahr
16.327
-4.506
-21.63%
1 Jan 2010 Jahr
14.611
-1.716
-10.51%
1 Jan 2011 Jahr
13.268
-1.342
-9.19%
1 Jan 2012 Jahr
12.111
-1.157
-8.72%

Bewertung der Länder gemäß mit laufender Statistik nach Jahren