33
/de/
AIzaSyAYiBZKx7MnpbEhh9jyipgxe19OcubqV5w
May 1, 2025
177995
Lesotho
LSO
true
2
1
Net incurrence of liabilities, total (% of GDP)
2014,2013,2012,2011,2010,2009,2008,2007,2006,2005,2004
Download
Bibliothek der Globalstatistik →Lesotho →

Net incurrence of liabilities, total (% of GDP)

Diese Statistik in anderen Ländern:

AfghanistanAlbaniaAlgeriaAngolaAntigua and BarbudaArmeniaAustraliaAustriaAzerbaijanBahamas, TheBahrainBangladeshBarbadosBelarusBelgiumBelizeBeninBhutanBoliviaBosnia and HerzegovinaBrazilBurkina FasoBurundiCabo VerdeCambodiaCanadaCentral African RepublicCentral Europe and the BalticsChileChinaColombiaCongo, Dem. Rep.Congo, Rep.Cote d'IvoireCroatiaCyprusCzech RepublicDominicaDominican RepublicEast Asia & Pacific (excluding high income)East Asia & Pacific (IDA & IBRD countries)Egypt, Arab Rep.El SalvadorEquatorial GuineaEstoniaEthiopiaEuro areaEurope & Central AsiaEurope & Central Asia (excluding high income)Europe & Central Asia (IDA & IBRD countries)European UnionFijiFinlandFranceGeorgiaGermanyGhanaGreeceGuatemalaHigh incomeHondurasHong Kong SAR, ChinaHungaryIBRD onlyIcelandIDA & IBRD totalIndiaIndonesiaIran, Islamic Rep.IraqIrelandIsraelItalyJamaicaJapanJordanKazakhstanKiribatiKorea, Rep.Kyrgyz RepublicLao PDRLate-demographic dividendLebanonLesothoLithuaniaLow & middle incomeLow incomeLower middle incomeLuxembourgMacedonia, FYRMadagascarMalawiMalaysiaMaldivesMaliMaltaMauritiusMicronesia, Fed. Sts.Middle East & North Africa (excluding high income)Middle East & North Africa (IDA & IBRD countries)Middle incomeMoldovaMongoliaMoroccoMozambiqueNamibiaNepalNetherlandsNew ZealandNigeriaNorth AmericaNorwayOECD membersOmanPacific island small statesParaguayPeruPhilippinesPolandPortugalPost-demographic dividendRomaniaRussian FederationRwandaSamoaSan MarinoSao Tome and PrincipeSenegalSerbiaSeychellesSierra LeoneSingaporeSlovak RepublicSolomon IslandsSouth AfricaSouth AsiaSouth Asia (IDA & IBRD)SpainSri LankaSt. Kitts and NevisSub-Saharan Africa Sub-Saharan Africa (excluding high income)Sub-Saharan Africa (IDA & IBRD countries)SurinameSwazilandSwedenSwitzerlandSyrian Arab RepublicTanzaniaThailandTogoTrinidad and TobagoTurkeyUgandaUkraineUnited Arab EmiratesUnited KingdomUnited StatesUpper middle incomeUruguayVanuatuVietnamWest Bank and GazaZimbabwe

Zeitlinie:

Diese Zeitleiste vorliegt die Graphik ab 2004 J. bis 2014 J. Lesotho. Die Angaben bis 2003 J. sind nicht vorhanden. Die Zahl aktueller Beobachtungen nach Daten: 11.

Die Quelle (Bezeichnung):

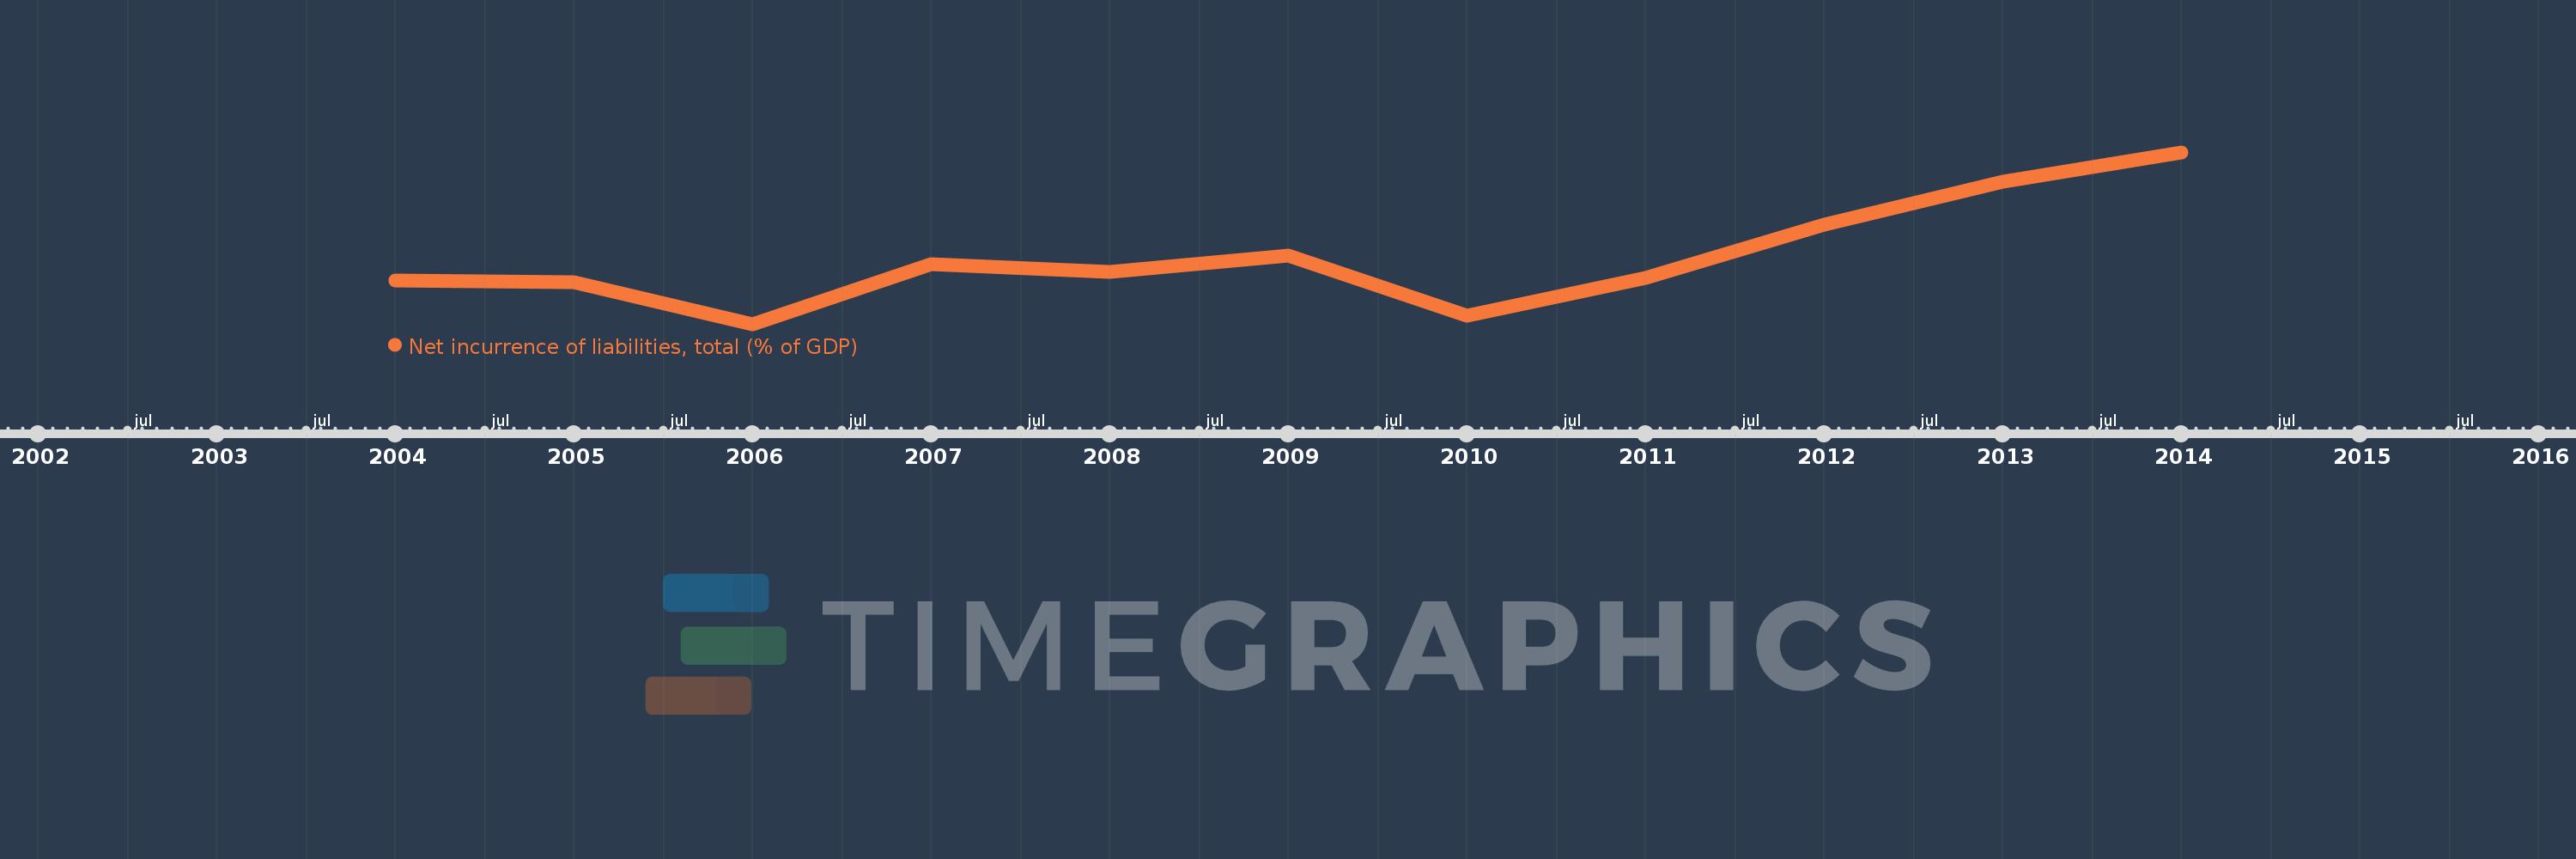
Kennzahlen der Weltentwicklung

Die Quelle (Einrichtung):

International Monetary Fund, Government Finance Statistics Yearbook and data files.

Kategorien:

Public Sector

Es wurde aktualisiert:

23 Apr 2017 Jahr

Kennzahlen der Wertänderungen vom Jahr zum Jahr

im Durchschnitt:
0.898
Minimum:
-2.585
1 Jan 2006 Jahr
Maximum:
6.373
1 Jan 2014 Jahr
Zum Datum der Beobachtung
Wert
Absolute Veränderung
Die Veränderung bezüglich dem vorherigen Wert
1 Jan 2004 Jahr
-0.293
-0.293
0.0%
1 Jan 2005 Jahr
-0.392
-0.099
33.71%
1 Jan 2006 Jahr
-2.585
-2.193
559.0%
1 Jan 2007 Jahr
0.526
+3.111
-120.34%
1 Jan 2008 Jahr
0.133
-0.393
-74.72%
1 Jan 2009 Jahr
0.977
+0.844
634.75%
1 Jan 2010 Jahr
-2.155
-3.132
-320.54%
1 Jan 2011 Jahr
-0.173
+1.982
-91.99%
1 Jan 2012 Jahr
2.611
+2.783
-1.61 Tsnd.%
1 Jan 2013 Jahr
4.854
+2.243
85.93%
1 Jan 2014 Jahr
6.373
+1.519
31.29%

Bewertung der Länder gemäß mit laufender Statistik nach Jahren