33
/de/
AIzaSyAYiBZKx7MnpbEhh9jyipgxe19OcubqV5w
August 1, 2025
134415
France
FRA
true
2
1
Net incurrence of liabilities, total (% of GDP)
1995,1994,1993,1992,1991,1990,1989,1988,1987,1986,1985,1984,1983,1982,1981,1980,1979,1978,1977,1976,1975,1974,1973
Download
Bibliothek der Globalstatistik →France →

Net incurrence of liabilities, total (% of GDP)

Diese Statistik in anderen Ländern:

AfghanistanAlbaniaAlgeriaAngolaAntigua and BarbudaArmeniaAustraliaAustriaAzerbaijanBahamas, TheBahrainBangladeshBarbadosBelarusBelgiumBelizeBeninBhutanBoliviaBosnia and HerzegovinaBrazilBurkina FasoBurundiCabo VerdeCambodiaCanadaCentral African RepublicCentral Europe and the BalticsChileChinaColombiaCongo, Dem. Rep.Congo, Rep.Cote d'IvoireCroatiaCyprusCzech RepublicDominicaDominican RepublicEast Asia & Pacific (excluding high income)East Asia & Pacific (IDA & IBRD countries)Egypt, Arab Rep.El SalvadorEquatorial GuineaEstoniaEthiopiaEuro areaEurope & Central AsiaEurope & Central Asia (excluding high income)Europe & Central Asia (IDA & IBRD countries)European UnionFijiFinlandFranceGeorgiaGermanyGhanaGreeceGuatemalaHigh incomeHondurasHong Kong SAR, ChinaHungaryIBRD onlyIcelandIDA & IBRD totalIndiaIndonesiaIran, Islamic Rep.IraqIrelandIsraelItalyJamaicaJapanJordanKazakhstanKiribatiKorea, Rep.Kyrgyz RepublicLao PDRLate-demographic dividendLebanonLesothoLithuaniaLow & middle incomeLow incomeLower middle incomeLuxembourgMacedonia, FYRMadagascarMalawiMalaysiaMaldivesMaliMaltaMauritiusMicronesia, Fed. Sts.Middle East & North Africa (excluding high income)Middle East & North Africa (IDA & IBRD countries)Middle incomeMoldovaMongoliaMoroccoMozambiqueNamibiaNepalNetherlandsNew ZealandNigeriaNorth AmericaNorwayOECD membersOmanPacific island small statesParaguayPeruPhilippinesPolandPortugalPost-demographic dividendRomaniaRussian FederationRwandaSamoaSan MarinoSao Tome and PrincipeSenegalSerbiaSeychellesSierra LeoneSingaporeSlovak RepublicSolomon IslandsSouth AfricaSouth AsiaSouth Asia (IDA & IBRD)SpainSri LankaSt. Kitts and NevisSub-Saharan Africa Sub-Saharan Africa (excluding high income)Sub-Saharan Africa (IDA & IBRD countries)SurinameSwazilandSwedenSwitzerlandSyrian Arab RepublicTanzaniaThailandTogoTrinidad and TobagoTurkeyUgandaUkraineUnited Arab EmiratesUnited KingdomUnited StatesUpper middle incomeUruguayVanuatuVietnamWest Bank and GazaZimbabwe

Zeitlinie:

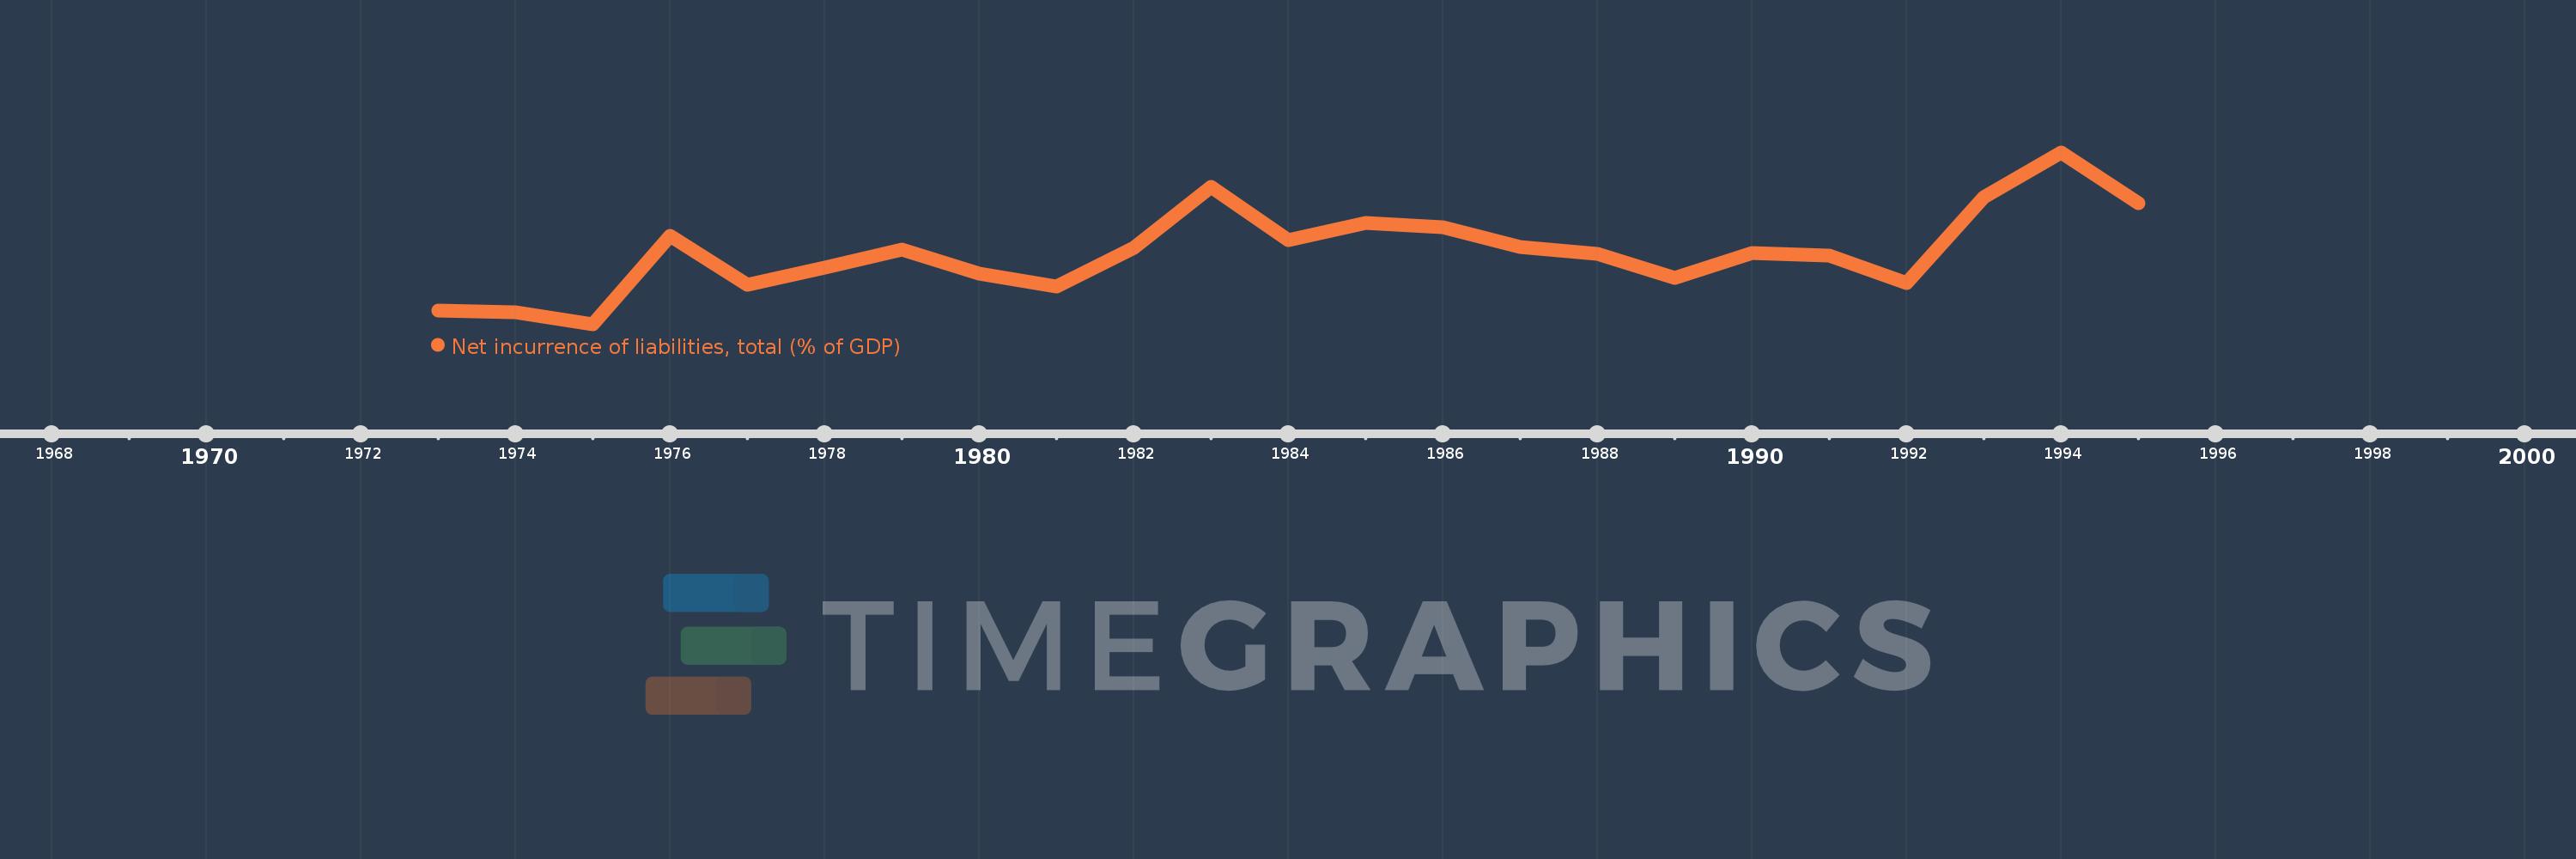
Diese Zeitleiste vorliegt die Graphik ab 1973 J. bis 1995 J. France. Die Angaben bis 1972 J. sind nicht vorhanden. Die Zahl aktueller Beobachtungen nach Daten: 23.

Die Quelle (Bezeichnung):

Kennzahlen der Weltentwicklung

Die Quelle (Einrichtung):

International Monetary Fund, Government Finance Statistics Yearbook and data files.

Kategorien:

Public Sector

Es wurde aktualisiert:

23 Apr 2017 Jahr

Kennzahlen der Wertänderungen vom Jahr zum Jahr

im Durchschnitt:
2.352
Minimum:
-0.385
1 Jan 1975 Jahr
Maximum:
6.11
1 Jan 1994 Jahr
Zum Datum der Beobachtung
Wert
Absolute Veränderung
Die Veränderung bezüglich dem vorherigen Wert
1 Jan 1973 Jahr
0.146
+0.146
0.0%
1 Jan 1974 Jahr
0.076
-0.069
-47.68%
1 Jan 1975 Jahr
-0.385
-0.461
-604.96%
1 Jan 1976 Jahr
2.951
+3.335
-867.16%
1 Jan 1977 Jahr
1.104
-1.847
-62.58%
1 Jan 1978 Jahr
1.769
+0.665
60.21%
1 Jan 1979 Jahr
2.437
+0.669
37.8%
1 Jan 1980 Jahr
1.542
-0.895
-36.74%
1 Jan 1981 Jahr
1.056
-0.486
-31.5%
1 Jan 1982 Jahr
2.497
+1.441
136.39%
1 Jan 1983 Jahr
4.792
+2.295
91.91%
1 Jan 1984 Jahr
2.8
-1.992
-41.57%
1 Jan 1985 Jahr
3.448
+0.648
23.14%
1 Jan 1986 Jahr
3.294
-0.154
-4.48%
1 Jan 1987 Jahr
2.526
-0.768
-23.31%
1 Jan 1988 Jahr
2.277
-0.249
-9.86%
1 Jan 1989 Jahr
1.373
-0.904
-39.69%
1 Jan 1990 Jahr
2.311
+0.937
68.27%
1 Jan 1991 Jahr
2.199
-0.112
-4.83%
1 Jan 1992 Jahr
1.177
-1.022
-46.48%
1 Jan 1993 Jahr
4.409
+3.232
274.63%
1 Jan 1994 Jahr
6.11
+1.701
38.58%
1 Jan 1995 Jahr
4.198
-1.912
-31.29%

Bewertung der Länder gemäß mit laufender Statistik nach Jahren