33
/de/
AIzaSyAYiBZKx7MnpbEhh9jyipgxe19OcubqV5w
August 1, 2025
189330
Maldives
MDV
true
2
1
Net incurrence of liabilities, total (% of GDP)
2012,2011,2010,2009,2008,2007,2006,2005,2004,2003,2002,2001,2000,1999,1998,1997,1996,1995,1994,1993,1992,1991
Download
Bibliothek der Globalstatistik →Maldives →

Net incurrence of liabilities, total (% of GDP)

Diese Statistik in anderen Ländern:

AfghanistanAlbaniaAlgeriaAngolaAntigua and BarbudaArmeniaAustraliaAustriaAzerbaijanBahamas, TheBahrainBangladeshBarbadosBelarusBelgiumBelizeBeninBhutanBoliviaBosnia and HerzegovinaBrazilBurkina FasoBurundiCabo VerdeCambodiaCanadaCentral African RepublicCentral Europe and the BalticsChileChinaColombiaCongo, Dem. Rep.Congo, Rep.Cote d'IvoireCroatiaCyprusCzech RepublicDominicaDominican RepublicEast Asia & Pacific (excluding high income)East Asia & Pacific (IDA & IBRD countries)Egypt, Arab Rep.El SalvadorEquatorial GuineaEstoniaEthiopiaEuro areaEurope & Central AsiaEurope & Central Asia (excluding high income)Europe & Central Asia (IDA & IBRD countries)European UnionFijiFinlandFranceGeorgiaGermanyGhanaGreeceGuatemalaHigh incomeHondurasHong Kong SAR, ChinaHungaryIBRD onlyIcelandIDA & IBRD totalIndiaIndonesiaIran, Islamic Rep.IraqIrelandIsraelItalyJamaicaJapanJordanKazakhstanKiribatiKorea, Rep.Kyrgyz RepublicLao PDRLate-demographic dividendLebanonLesothoLithuaniaLow & middle incomeLow incomeLower middle incomeLuxembourgMacedonia, FYRMadagascarMalawiMalaysiaMaldivesMaliMaltaMauritiusMicronesia, Fed. Sts.Middle East & North Africa (excluding high income)Middle East & North Africa (IDA & IBRD countries)Middle incomeMoldovaMongoliaMoroccoMozambiqueNamibiaNepalNetherlandsNew ZealandNigeriaNorth AmericaNorwayOECD membersOmanPacific island small statesParaguayPeruPhilippinesPolandPortugalPost-demographic dividendRomaniaRussian FederationRwandaSamoaSan MarinoSao Tome and PrincipeSenegalSerbiaSeychellesSierra LeoneSingaporeSlovak RepublicSolomon IslandsSouth AfricaSouth AsiaSouth Asia (IDA & IBRD)SpainSri LankaSt. Kitts and NevisSub-Saharan Africa Sub-Saharan Africa (excluding high income)Sub-Saharan Africa (IDA & IBRD countries)SurinameSwazilandSwedenSwitzerlandSyrian Arab RepublicTanzaniaThailandTogoTrinidad and TobagoTurkeyUgandaUkraineUnited Arab EmiratesUnited KingdomUnited StatesUpper middle incomeUruguayVanuatuVietnamWest Bank and GazaZimbabwe

Zeitlinie:

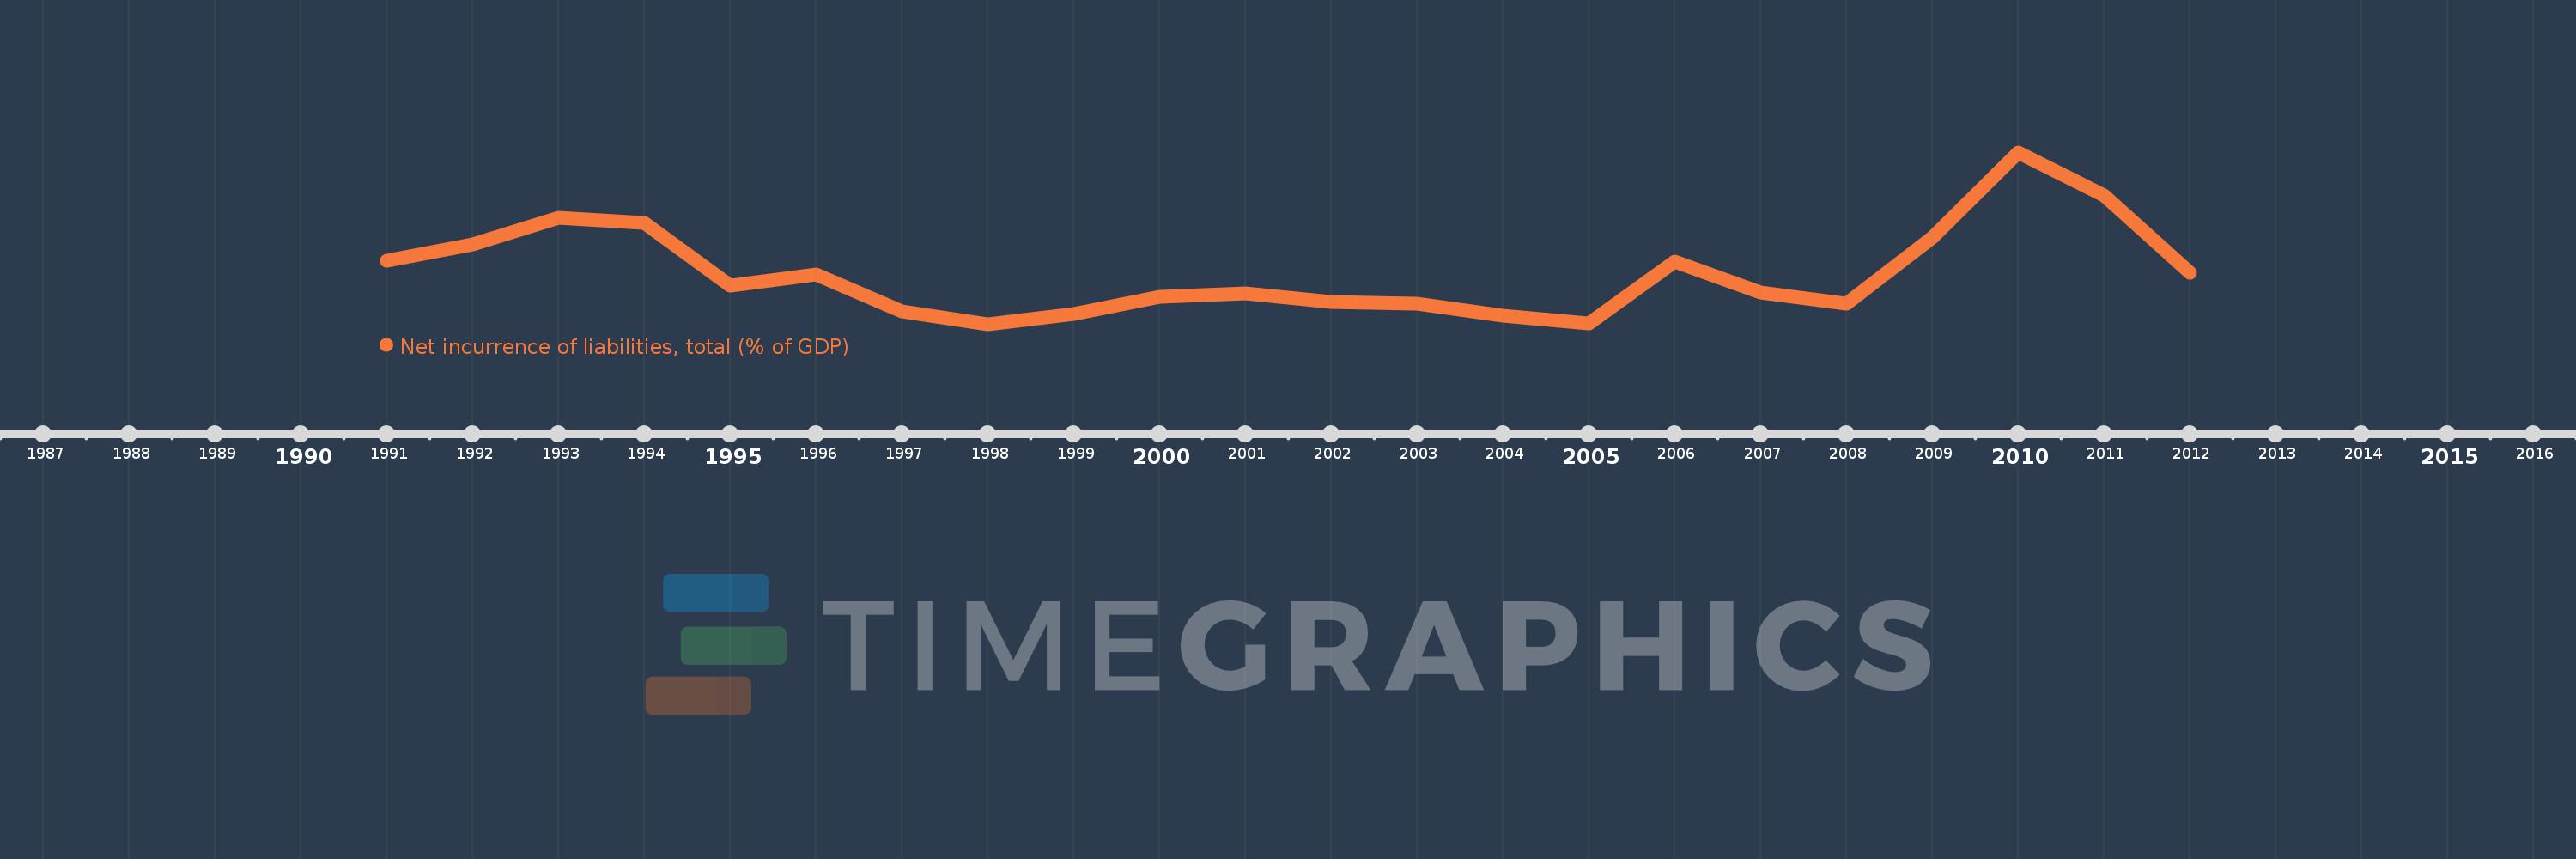
Diese Zeitleiste vorliegt die Graphik ab 1991 J. bis 2012 J. Maldives. Die Angaben bis 1990 J. sind nicht vorhanden. Die Zahl aktueller Beobachtungen nach Daten: 22.

Die Quelle (Bezeichnung):

Kennzahlen der Weltentwicklung

Die Quelle (Einrichtung):

International Monetary Fund, Government Finance Statistics Yearbook and data files.

Kategorien:

Public Sector

Es wurde aktualisiert:

23 Apr 2017 Jahr

Kennzahlen der Wertänderungen vom Jahr zum Jahr

im Durchschnitt:
6.551
Minimum:
1.287
1 Jan 1998 Jahr
Maximum:
18.96
1 Jan 2010 Jahr
Zum Datum der Beobachtung
Wert
Absolute Veränderung
Die Veränderung bezüglich dem vorherigen Wert
1 Jan 1991 Jahr
7.857
+7.857
0.0%
1 Jan 1992 Jahr
9.482
+1.625
20.68%
1 Jan 1993 Jahr
12.199
+2.717
28.65%
1 Jan 1994 Jahr
11.699
-0.5
-4.1%
1 Jan 1995 Jahr
5.225
-6.475
-55.34%
1 Jan 1996 Jahr
6.442
+1.217
23.29%
1 Jan 1997 Jahr
2.615
-3.827
-59.41%
1 Jan 1998 Jahr
1.287
-1.327
-50.77%
1 Jan 1999 Jahr
2.372
+1.085
84.29%
1 Jan 2000 Jahr
4.104
+1.731
72.99%
1 Jan 2001 Jahr
4.464
+0.36
8.77%
1 Jan 2002 Jahr
3.61
-0.854
-19.13%
1 Jan 2003 Jahr
3.427
-0.183
-5.08%
1 Jan 2004 Jahr
2.12
-1.306
-38.12%
1 Jan 2005 Jahr
1.339
-0.782
-36.87%
1 Jan 2006 Jahr
7.695
+6.356
474.8%
1 Jan 2007 Jahr
4.512
-3.183
-41.37%
1 Jan 2008 Jahr
3.428
-1.084
-24.02%
1 Jan 2009 Jahr
10.182
+6.754
197.03%
1 Jan 2010 Jahr
18.96
+8.778
86.2%
1 Jan 2011 Jahr
14.512
-4.448
-23.46%
1 Jan 2012 Jahr
6.598
-7.913
-54.53%

Bewertung der Länder gemäß mit laufender Statistik nach Jahren