33
/de/
AIzaSyAYiBZKx7MnpbEhh9jyipgxe19OcubqV5w
August 1, 2025
279032
Uzbekistan
UZB
true
2
1
Net bilateral aid flows from DAC donors, Greece (current US$)
2015,2014,2013,2012,2011,2010,2009,2008,2007,2006,2005,2004,2003,2002,2001,2000,1999,1998
Download
Bibliothek der Globalstatistik →Uzbekistan →

Net bilateral aid flows from DAC donors, Greece (current US$)

Diese Statistik in anderen Ländern:

AfghanistanAlbaniaAlgeriaAngolaAntigua and BarbudaArab WorldArgentinaArmeniaAzerbaijanBangladeshBarbadosBelarusBelizeBeninBhutanBoliviaBosnia and HerzegovinaBotswanaBrazilBulgariaBurkina FasoBurundiCabo VerdeCambodiaCameroonCaribbean small statesCentral African RepublicCentral Europe and the BalticsChadChileChinaColombiaComorosCongo, Dem. Rep.Congo, Rep.Costa RicaCote d'IvoireCroatiaCubaCyprusCzech RepublicDjiboutiDominicaDominican RepublicEast Asia & PacificEast Asia & Pacific (excluding high income)East Asia & Pacific (IDA & IBRD countries)EcuadorEgypt, Arab Rep.El SalvadorEquatorial GuineaEritreaEstoniaEthiopiaEuro areaEurope & Central AsiaEurope & Central Asia (excluding high income)Europe & Central Asia (IDA & IBRD countries)European UnionFijiFragile and conflict affected situationsGabonGambia, TheGeorgiaGhanaGrenadaGuatemalaGuineaGuinea-BissauGuyanaHaitiHeavily indebted poor countries (HIPC)High incomeHondurasHungaryIBRD onlyIDA & IBRD totalIDA blendIDA onlyIDA totalIndiaIndonesiaIran, Islamic Rep.IraqIsraelJamaicaJordanKazakhstanKenyaKiribatiKorea, Dem. People’s Rep.Korea, Rep.KosovoKyrgyz RepublicLao PDRLatin America & Caribbean Latin America & Caribbean (excluding high income)Latin America & the Caribbean (IDA & IBRD countries)LatviaLeast developed countries: UN classificationLebanonLesothoLiberiaLibyaLithuaniaLow & middle incomeLow incomeLower middle incomeMacedonia, FYRMadagascarMalawiMaldivesMaliMaltaMarshall IslandsMauritaniaMauritiusMexicoMicronesia, Fed. Sts.Middle East & North AfricaMiddle East & North Africa (excluding high income)Middle East & North Africa (IDA & IBRD countries)Middle incomeMoldovaMongoliaMontenegroMoroccoMozambiqueMyanmarNamibiaNauruNepalNicaraguaNigerNigeriaOECD membersOmanOther small statesPacific island small statesPakistanPalauPanamaPapua New GuineaPeruPhilippinesPolandRomaniaRussian FederationRwandaSamoaSao Tome and PrincipeSaudi ArabiaSenegalSerbiaSeychellesSierra LeoneSlovak RepublicSloveniaSmall statesSolomon IslandsSomaliaSouth AfricaSouth AsiaSouth Asia (IDA & IBRD)Sri LankaSt. Kitts and NevisSt. LuciaSt. Vincent and the GrenadinesSub-Saharan Africa Sub-Saharan Africa (excluding high income)Sub-Saharan Africa (IDA & IBRD countries)SudanSurinameSwazilandSyrian Arab RepublicTajikistanTanzaniaThailandTimor-LesteTogoTongaTrinidad and TobagoTunisiaTurkeyTurkmenistanTuvaluUgandaUkraineUpper middle incomeUruguayUzbekistanVanuatuVenezuela, RBVietnamWest Bank and GazaWorldYemen, Rep.ZambiaZimbabwe

Zeitlinie:

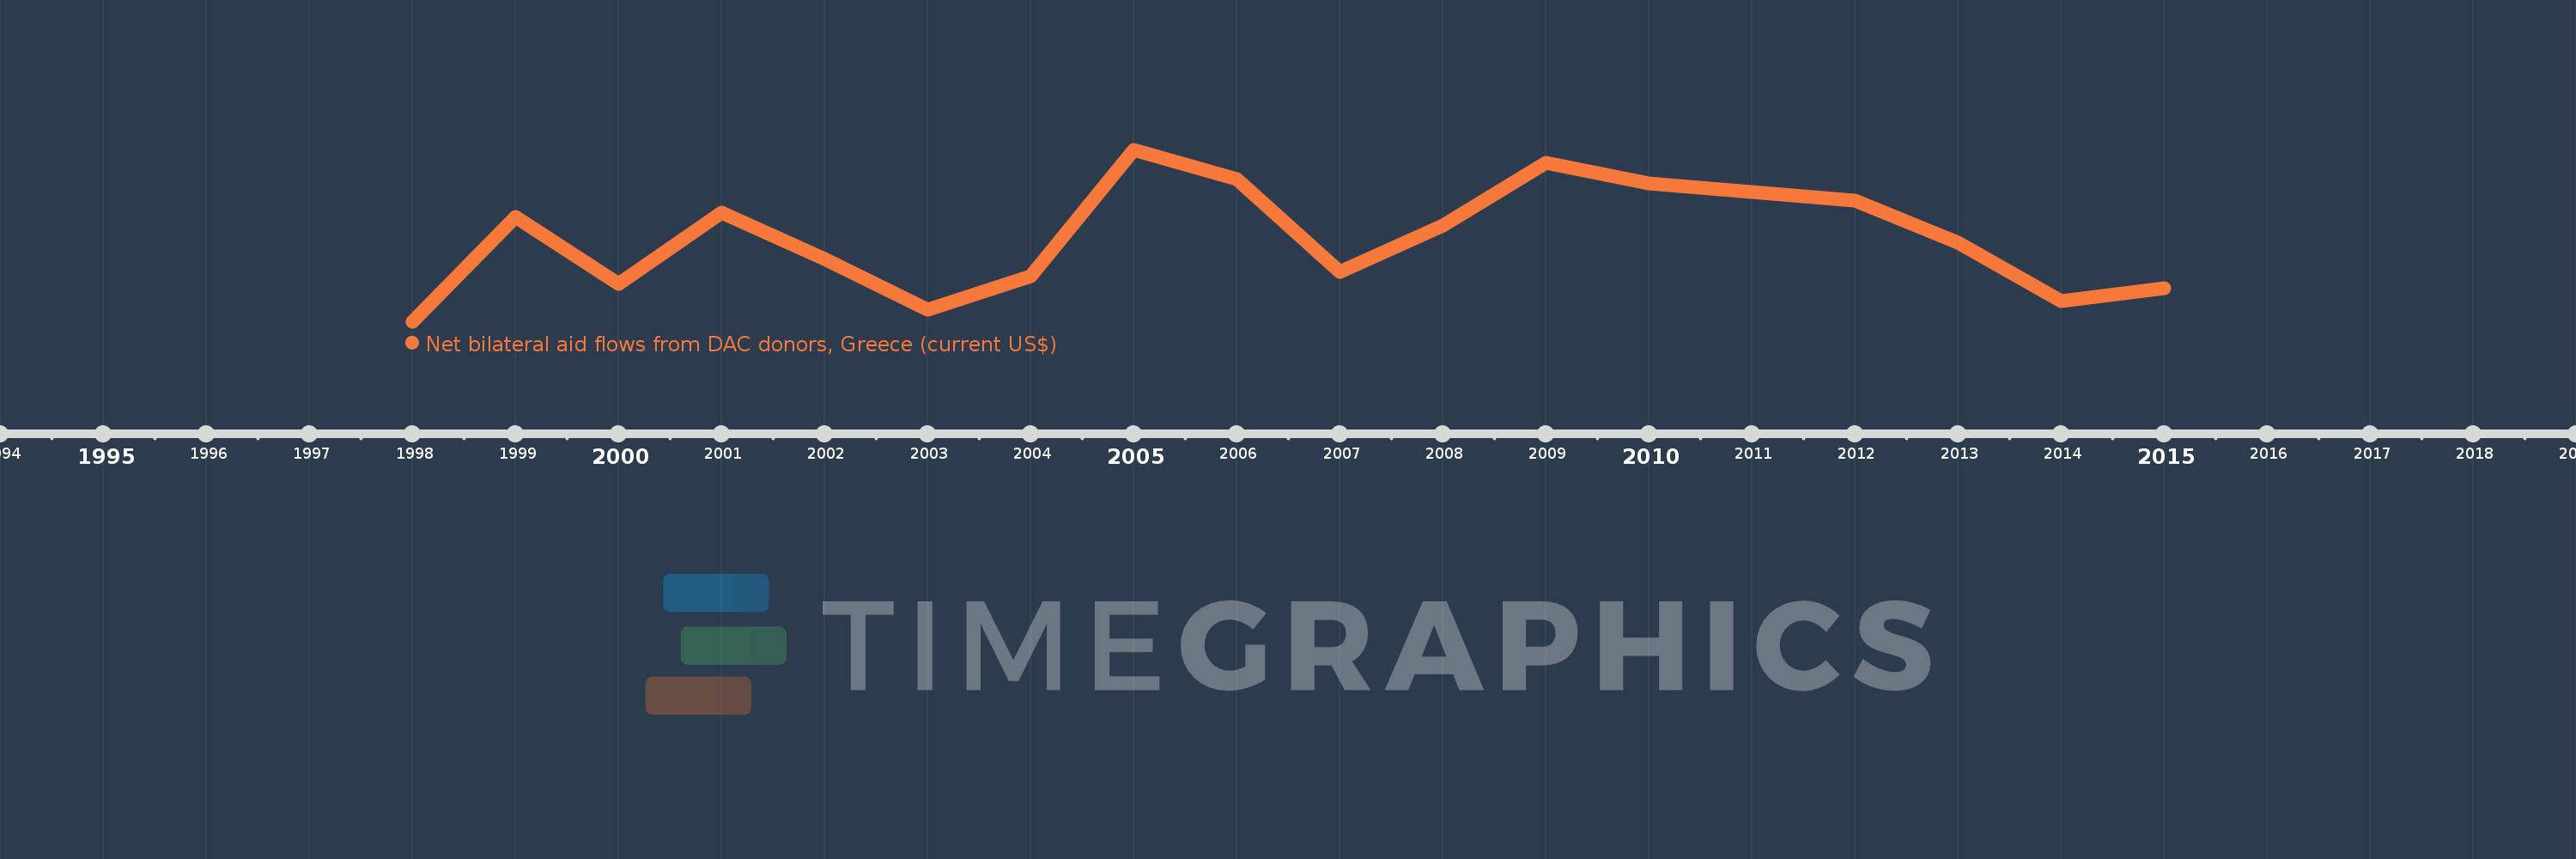
Diese Zeitleiste vorliegt die Graphik ab 1998 J. bis 2015 J. Uzbekistan. Die Angaben bis 1997 J. sind nicht vorhanden. Die Zahl aktueller Beobachtungen nach Daten: 18.

Die Quelle (Bezeichnung):

Kennzahlen der Weltentwicklung

Die Quelle (Einrichtung):

Development Assistance Committee of the Organisation for Economic Co-operation and Development, Geographical Distribution of Financial Flows to Developing Countries, Development Co-operation Report, and International Development Statistics database. Data are available online at: www.oecd.org/dac/stats/idsonline.

Kategorien:

Aid Effectiveness

Es wurde aktualisiert:

23 Apr 2017 Jahr

Kennzahlen der Wertänderungen vom Jahr zum Jahr

im Durchschnitt:
261.111 Tsnd.
Minimum:
60.0 Tsnd.
1 Jan 1998 Jahr
Maximum:
470.0 Tsnd.
1 Jan 2005 Jahr
Zum Datum der Beobachtung
Wert
Absolute Veränderung
Die Veränderung bezüglich dem vorherigen Wert
1 Jan 1998 Jahr
60.0 Tsnd.
+60.0 Tsnd.
0.0%
1 Jan 1999 Jahr
310.0 Tsnd.
+250.0 Tsnd.
416.67%
1 Jan 2000 Jahr
150.0 Tsnd.
-160.0 Tsnd.
-51.61%
1 Jan 2001 Jahr
320.0 Tsnd.
+170.0 Tsnd.
113.33%
1 Jan 2002 Jahr
210.0 Tsnd.
-110.0 Tsnd.
-34.38%
1 Jan 2003 Jahr
90.0 Tsnd.
-120.0 Tsnd.
-57.14%
1 Jan 2004 Jahr
170.0 Tsnd.
+80.0 Tsnd.
88.89%
1 Jan 2005 Jahr
470.0 Tsnd.
+300.0 Tsnd.
176.47%
1 Jan 2006 Jahr
400.0 Tsnd.
-70.0 Tsnd.
-14.89%
1 Jan 2007 Jahr
180.0 Tsnd.
-220.0 Tsnd.
-55.0%
1 Jan 2008 Jahr
290.0 Tsnd.
+110.0 Tsnd.
61.11%
1 Jan 2009 Jahr
440.0 Tsnd.
+150.0 Tsnd.
51.72%
1 Jan 2010 Jahr
390.0 Tsnd.
-50.0 Tsnd.
-11.36%
1 Jan 2011 Jahr
370.0 Tsnd.
-20.0 Tsnd.
-5.13%
1 Jan 2012 Jahr
350.0 Tsnd.
-20.0 Tsnd.
-5.41%
1 Jan 2013 Jahr
250.0 Tsnd.
-100.0 Tsnd.
-28.57%
1 Jan 2014 Jahr
110.0 Tsnd.
-140.0 Tsnd.
-56.0%
1 Jan 2015 Jahr
140.0 Tsnd.
+30.0 Tsnd.
27.27%

Bewertung der Länder gemäß mit laufender Statistik nach Jahren