33
/de/
AIzaSyAYiBZKx7MnpbEhh9jyipgxe19OcubqV5w
August 1, 2025
113924
Cote d'Ivoire
CIV
true
2
1
Net bilateral aid flows from DAC donors, Greece (current US$)
2015,2014,2013,2012,2011,2010,2009,2008,2007,2006,2005,2004,2003,2002,2001,2000,1999,1998,1997
Download
Bibliothek der Globalstatistik →Cote d'Ivoire →

Net bilateral aid flows from DAC donors, Greece (current US$)

Diese Statistik in anderen Ländern:

AfghanistanAlbaniaAlgeriaAngolaAntigua and BarbudaArab WorldArgentinaArmeniaAzerbaijanBangladeshBarbadosBelarusBelizeBeninBhutanBoliviaBosnia and HerzegovinaBotswanaBrazilBulgariaBurkina FasoBurundiCabo VerdeCambodiaCameroonCaribbean small statesCentral African RepublicCentral Europe and the BalticsChadChileChinaColombiaComorosCongo, Dem. Rep.Congo, Rep.Costa RicaCote d'IvoireCroatiaCubaCyprusCzech RepublicDjiboutiDominicaDominican RepublicEast Asia & PacificEast Asia & Pacific (excluding high income)East Asia & Pacific (IDA & IBRD countries)EcuadorEgypt, Arab Rep.El SalvadorEquatorial GuineaEritreaEstoniaEthiopiaEuro areaEurope & Central AsiaEurope & Central Asia (excluding high income)Europe & Central Asia (IDA & IBRD countries)European UnionFijiFragile and conflict affected situationsGabonGambia, TheGeorgiaGhanaGrenadaGuatemalaGuineaGuinea-BissauGuyanaHaitiHeavily indebted poor countries (HIPC)High incomeHondurasHungaryIBRD onlyIDA & IBRD totalIDA blendIDA onlyIDA totalIndiaIndonesiaIran, Islamic Rep.IraqIsraelJamaicaJordanKazakhstanKenyaKiribatiKorea, Dem. People’s Rep.Korea, Rep.KosovoKyrgyz RepublicLao PDRLatin America & Caribbean Latin America & Caribbean (excluding high income)Latin America & the Caribbean (IDA & IBRD countries)LatviaLeast developed countries: UN classificationLebanonLesothoLiberiaLibyaLithuaniaLow & middle incomeLow incomeLower middle incomeMacedonia, FYRMadagascarMalawiMaldivesMaliMaltaMarshall IslandsMauritaniaMauritiusMexicoMicronesia, Fed. Sts.Middle East & North AfricaMiddle East & North Africa (excluding high income)Middle East & North Africa (IDA & IBRD countries)Middle incomeMoldovaMongoliaMontenegroMoroccoMozambiqueMyanmarNamibiaNauruNepalNicaraguaNigerNigeriaOECD membersOmanOther small statesPacific island small statesPakistanPalauPanamaPapua New GuineaPeruPhilippinesPolandRomaniaRussian FederationRwandaSamoaSao Tome and PrincipeSaudi ArabiaSenegalSerbiaSeychellesSierra LeoneSlovak RepublicSloveniaSmall statesSolomon IslandsSomaliaSouth AfricaSouth AsiaSouth Asia (IDA & IBRD)Sri LankaSt. Kitts and NevisSt. LuciaSt. Vincent and the GrenadinesSub-Saharan Africa Sub-Saharan Africa (excluding high income)Sub-Saharan Africa (IDA & IBRD countries)SudanSurinameSwazilandSyrian Arab RepublicTajikistanTanzaniaThailandTimor-LesteTogoTongaTrinidad and TobagoTunisiaTurkeyTurkmenistanTuvaluUgandaUkraineUpper middle incomeUruguayUzbekistanVanuatuVenezuela, RBVietnamWest Bank and GazaWorldYemen, Rep.ZambiaZimbabwe

Zeitlinie:

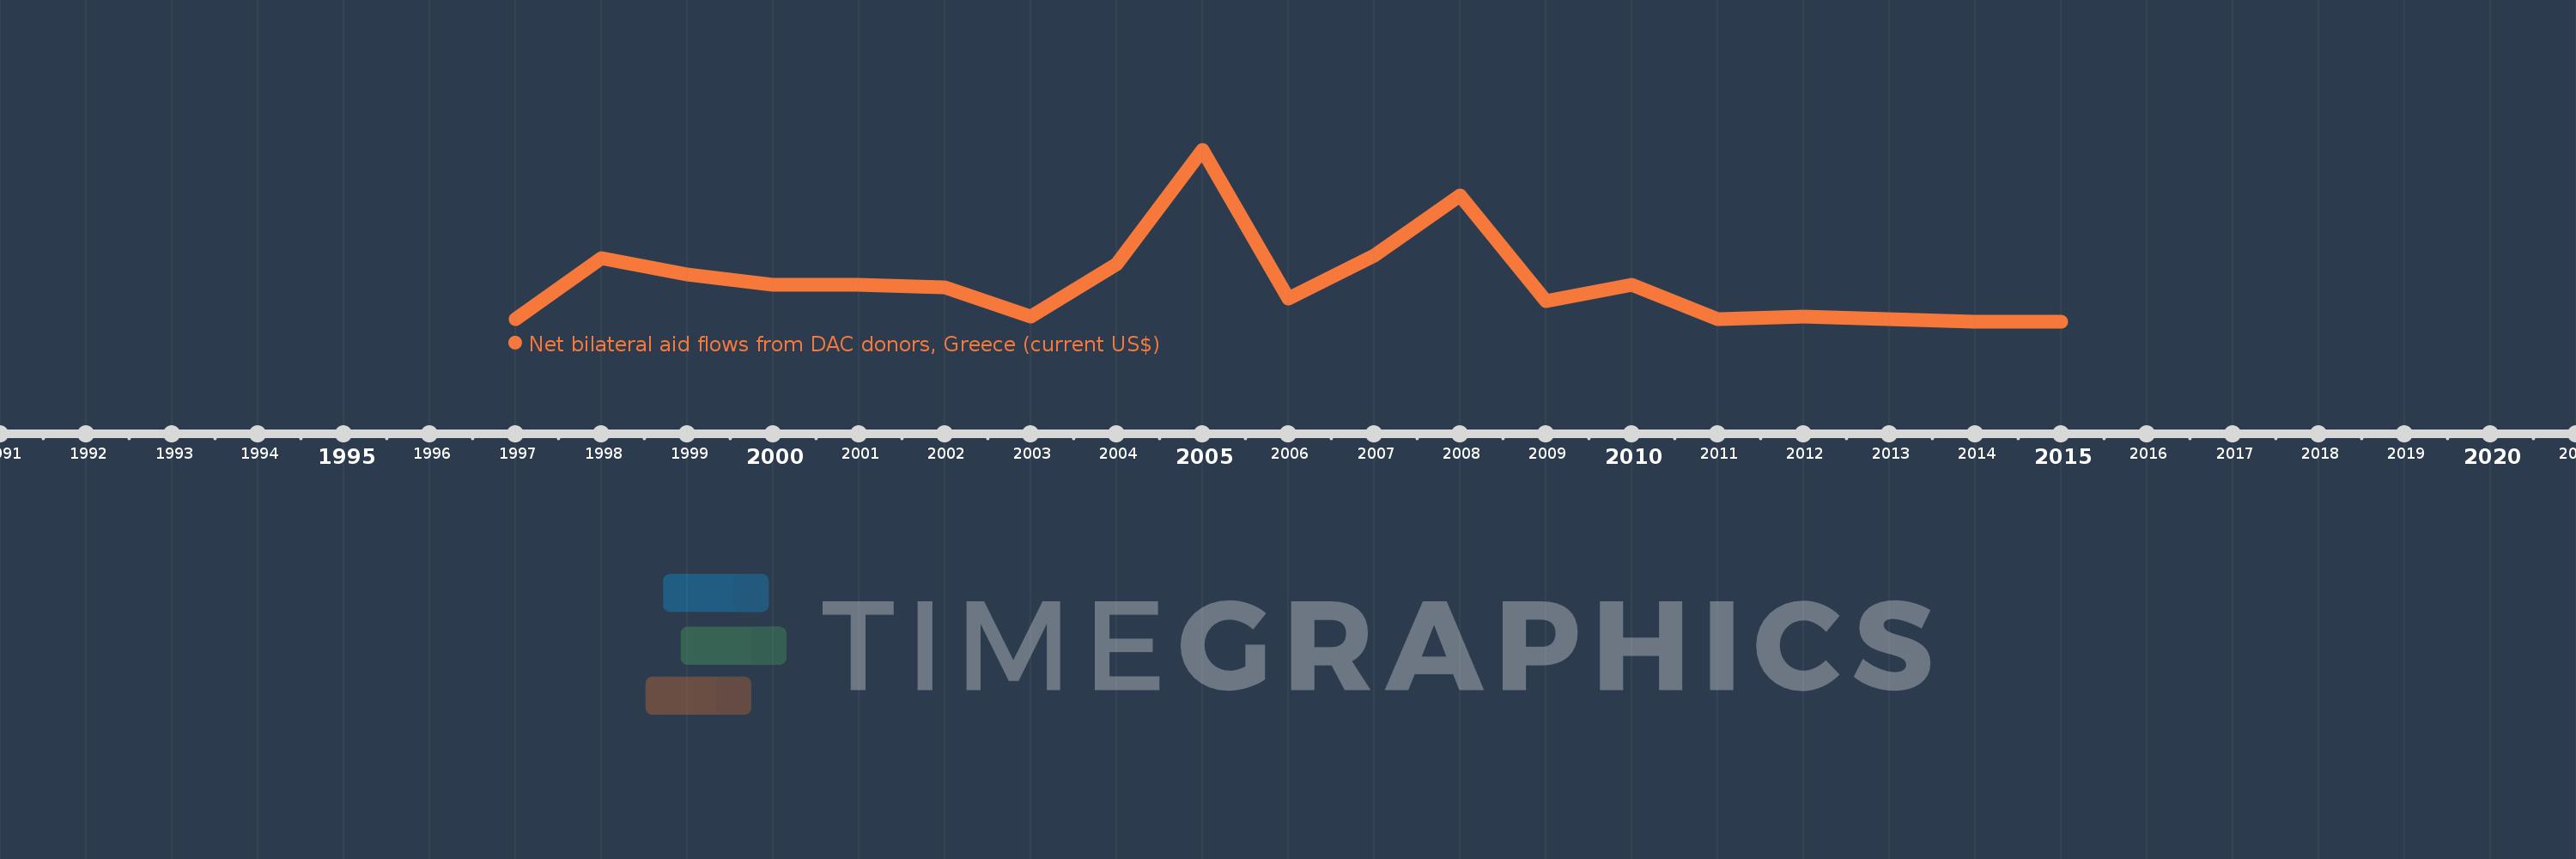
Diese Zeitleiste vorliegt die Graphik ab 1997 J. bis 2015 J. Cote d'Ivoire. Die Angaben bis 1996 J. sind nicht vorhanden. Die Zahl aktueller Beobachtungen nach Daten: 19.

Die Quelle (Bezeichnung):

Kennzahlen der Weltentwicklung

Die Quelle (Einrichtung):

Development Assistance Committee of the Organisation for Economic Co-operation and Development, Geographical Distribution of Financial Flows to Developing Countries, Development Co-operation Report, and International Development Statistics database. Data are available online at: www.oecd.org/dac/stats/idsonline.

Kategorien:

Aid Effectiveness

Es wurde aktualisiert:

23 Apr 2017 Jahr

Kennzahlen der Wertänderungen vom Jahr zum Jahr

im Durchschnitt:
157.895 Tsnd.
Minimum:
10.0 Tsnd.
1 Jan 2014 Jahr
Maximum:
660.0 Tsnd.
1 Jan 2005 Jahr
Zum Datum der Beobachtung
Wert
Absolute Veränderung
Die Veränderung bezüglich dem vorherigen Wert
1 Jan 1997 Jahr
20.0 Tsnd.
+20.0 Tsnd.
0.0%
1 Jan 1998 Jahr
250.0 Tsnd.
+230.0 Tsnd.
1.15 Tsnd.%
1 Jan 1999 Jahr
190.0 Tsnd.
-60.0 Tsnd.
-24.0%
1 Jan 2000 Jahr
150.0 Tsnd.
-40.0 Tsnd.
-21.05%
1 Jan 2001 Jahr
150.0 Tsnd.
0.0
0.0%
1 Jan 2002 Jahr
140.0 Tsnd.
-10.0 Tsnd.
-6.67%
1 Jan 2003 Jahr
30.0 Tsnd.
-110.0 Tsnd.
-78.57%
1 Jan 2004 Jahr
230.0 Tsnd.
+200.0 Tsnd.
666.67%
1 Jan 2005 Jahr
660.0 Tsnd.
+430.0 Tsnd.
186.96%
1 Jan 2006 Jahr
100.0 Tsnd.
-560.0 Tsnd.
-84.85%
1 Jan 2007 Jahr
260.0 Tsnd.
+160.0 Tsnd.
160.0%
1 Jan 2008 Jahr
490.0 Tsnd.
+230.0 Tsnd.
88.46%
1 Jan 2009 Jahr
90.0 Tsnd.
-400.0 Tsnd.
-81.63%
1 Jan 2010 Jahr
150.0 Tsnd.
+60.0 Tsnd.
66.67%
1 Jan 2011 Jahr
20.0 Tsnd.
-130.0 Tsnd.
-86.67%
1 Jan 2012 Jahr
30.0 Tsnd.
+10.0 Tsnd.
50.0%
1 Jan 2013 Jahr
20.0 Tsnd.
-10.0 Tsnd.
-33.33%
1 Jan 2014 Jahr
10.0 Tsnd.
-10.0 Tsnd.
-50.0%
1 Jan 2015 Jahr
10.0 Tsnd.
0.0
0.0%

Bewertung der Länder gemäß mit laufender Statistik nach Jahren