33
/de/
AIzaSyAYiBZKx7MnpbEhh9jyipgxe19OcubqV5w
May 1, 2025
125143
Egypt, Arab Rep.
EGY
true
2
1
Net bilateral aid flows from DAC donors, Greece (current US$)
2015,2014,2013,2012,2011,2010,2009,2008,2007,2006,2005,2004,2003,2002,2001,2000,1999,1998,1997
Download
Bibliothek der Globalstatistik →Egypt, Arab Rep. →

Net bilateral aid flows from DAC donors, Greece (current US$)

Diese Statistik in anderen Ländern:

AfghanistanAlbaniaAlgeriaAngolaAntigua and BarbudaArab WorldArgentinaArmeniaAzerbaijanBangladeshBarbadosBelarusBelizeBeninBhutanBoliviaBosnia and HerzegovinaBotswanaBrazilBulgariaBurkina FasoBurundiCabo VerdeCambodiaCameroonCaribbean small statesCentral African RepublicCentral Europe and the BalticsChadChileChinaColombiaComorosCongo, Dem. Rep.Congo, Rep.Costa RicaCote d'IvoireCroatiaCubaCyprusCzech RepublicDjiboutiDominicaDominican RepublicEast Asia & PacificEast Asia & Pacific (excluding high income)East Asia & Pacific (IDA & IBRD countries)EcuadorEgypt, Arab Rep.El SalvadorEquatorial GuineaEritreaEstoniaEthiopiaEuro areaEurope & Central AsiaEurope & Central Asia (excluding high income)Europe & Central Asia (IDA & IBRD countries)European UnionFijiFragile and conflict affected situationsGabonGambia, TheGeorgiaGhanaGrenadaGuatemalaGuineaGuinea-BissauGuyanaHaitiHeavily indebted poor countries (HIPC)High incomeHondurasHungaryIBRD onlyIDA & IBRD totalIDA blendIDA onlyIDA totalIndiaIndonesiaIran, Islamic Rep.IraqIsraelJamaicaJordanKazakhstanKenyaKiribatiKorea, Dem. People’s Rep.Korea, Rep.KosovoKyrgyz RepublicLao PDRLatin America & Caribbean Latin America & Caribbean (excluding high income)Latin America & the Caribbean (IDA & IBRD countries)LatviaLeast developed countries: UN classificationLebanonLesothoLiberiaLibyaLithuaniaLow & middle incomeLow incomeLower middle incomeMacedonia, FYRMadagascarMalawiMaldivesMaliMaltaMarshall IslandsMauritaniaMauritiusMexicoMicronesia, Fed. Sts.Middle East & North AfricaMiddle East & North Africa (excluding high income)Middle East & North Africa (IDA & IBRD countries)Middle incomeMoldovaMongoliaMontenegroMoroccoMozambiqueMyanmarNamibiaNauruNepalNicaraguaNigerNigeriaOECD membersOmanOther small statesPacific island small statesPakistanPalauPanamaPapua New GuineaPeruPhilippinesPolandRomaniaRussian FederationRwandaSamoaSao Tome and PrincipeSaudi ArabiaSenegalSerbiaSeychellesSierra LeoneSlovak RepublicSloveniaSmall statesSolomon IslandsSomaliaSouth AfricaSouth AsiaSouth Asia (IDA & IBRD)Sri LankaSt. Kitts and NevisSt. LuciaSt. Vincent and the GrenadinesSub-Saharan Africa Sub-Saharan Africa (excluding high income)Sub-Saharan Africa (IDA & IBRD countries)SudanSurinameSwazilandSyrian Arab RepublicTajikistanTanzaniaThailandTimor-LesteTogoTongaTrinidad and TobagoTunisiaTurkeyTurkmenistanTuvaluUgandaUkraineUpper middle incomeUruguayUzbekistanVanuatuVenezuela, RBVietnamWest Bank and GazaWorldYemen, Rep.ZambiaZimbabwe

Zeitlinie:

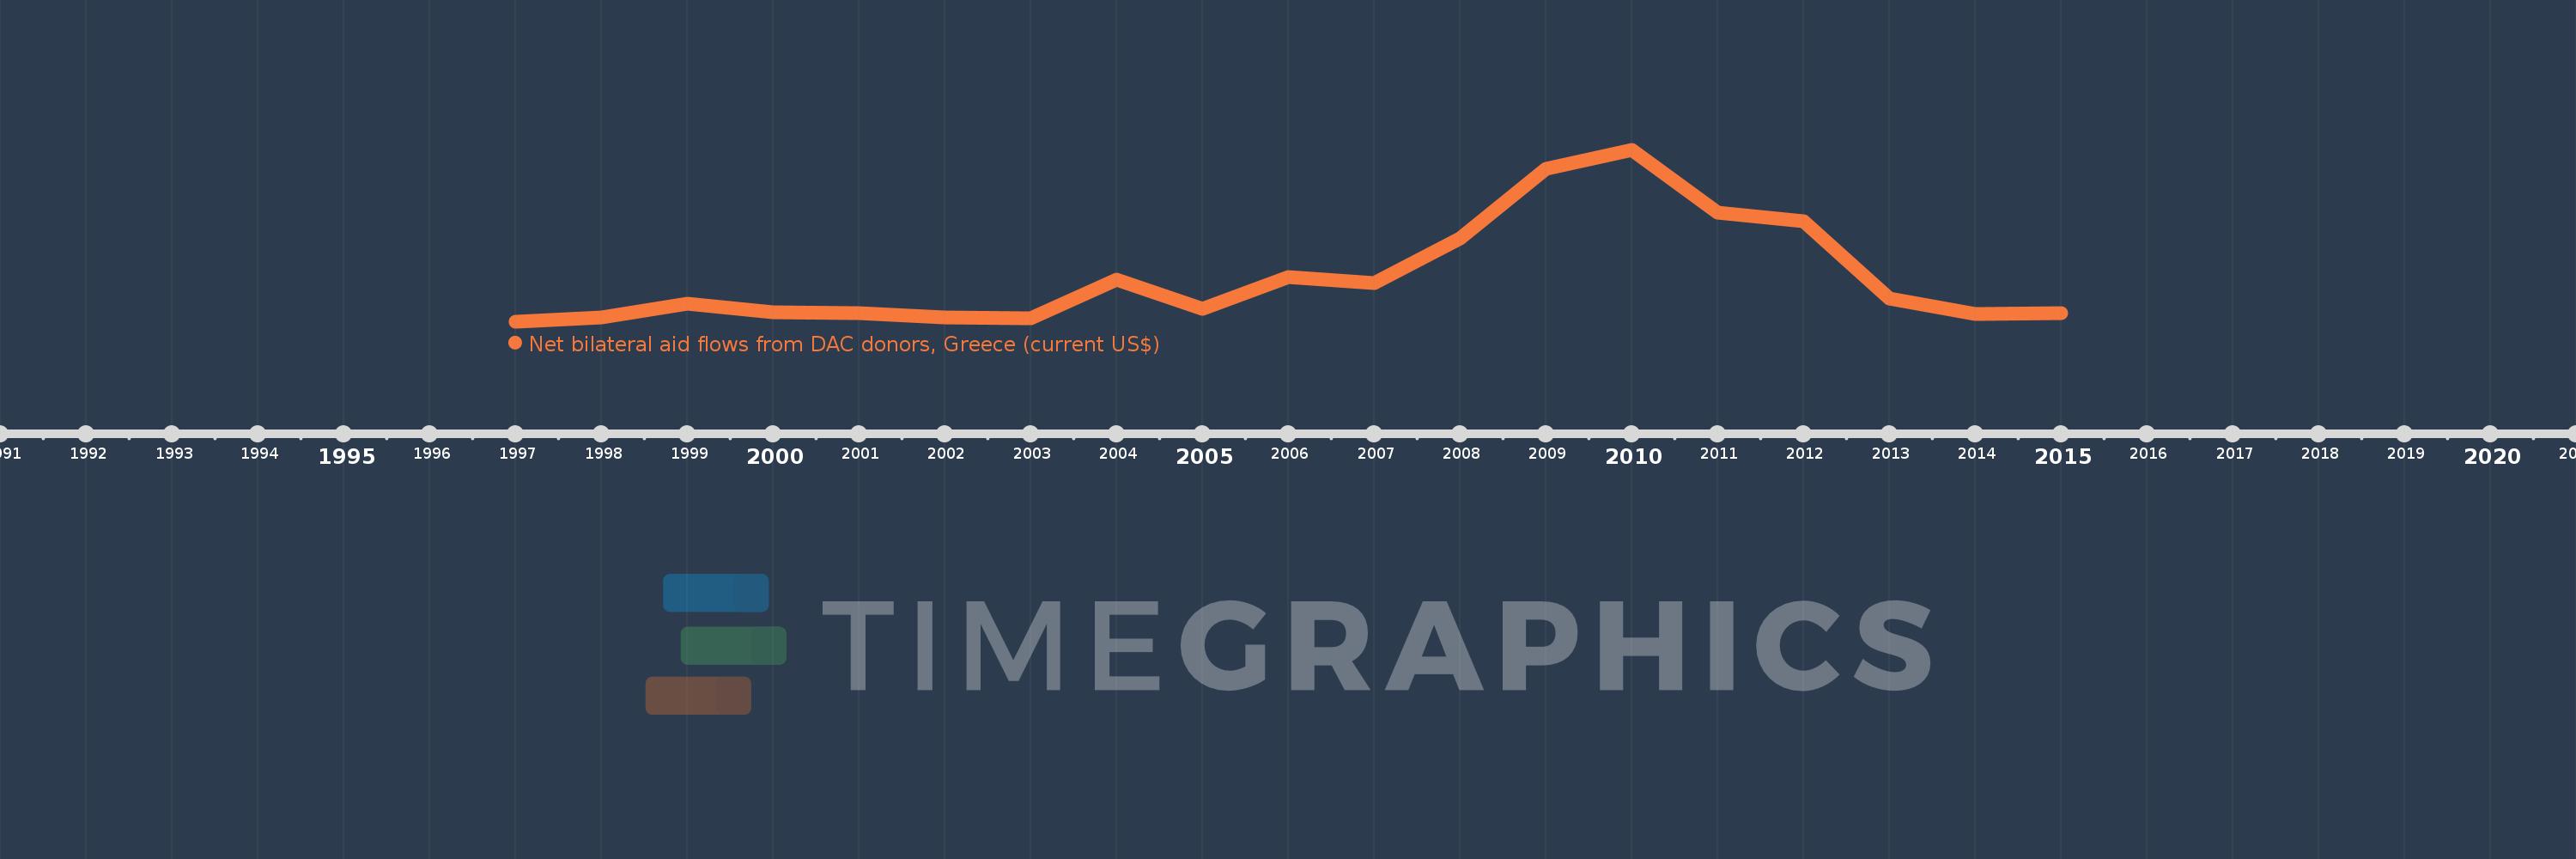
Diese Zeitleiste vorliegt die Graphik ab 1997 J. bis 2015 J. Egypt, Arab Rep.. Die Angaben bis 1996 J. sind nicht vorhanden. Die Zahl aktueller Beobachtungen nach Daten: 19.

Die Quelle (Bezeichnung):

Kennzahlen der Weltentwicklung

Die Quelle (Einrichtung):

Development Assistance Committee of the Organisation for Economic Co-operation and Development, Geographical Distribution of Financial Flows to Developing Countries, Development Co-operation Report, and International Development Statistics database. Data are available online at: www.oecd.org/dac/stats/idsonline.

Kategorien:

Aid Effectiveness

Es wurde aktualisiert:

23 Apr 2017 Jahr

Kennzahlen der Wertänderungen vom Jahr zum Jahr

im Durchschnitt:
3.721 Mln.
Minimum:
20.0 Tsnd.
1 Jan 1997 Jahr
Maximum:
14.3 Mln.
1 Jan 2010 Jahr
Zum Datum der Beobachtung
Wert
Absolute Veränderung
Die Veränderung bezüglich dem vorherigen Wert
1 Jan 1997 Jahr
20.0 Tsnd.
+20.0 Tsnd.
0.0%
1 Jan 1998 Jahr
370.0 Tsnd.
+350.0 Tsnd.
1.75 Tsnd.%
1 Jan 1999 Jahr
1.51 Mln.
+1.14 Mln.
308.11%
1 Jan 2000 Jahr
820.0 Tsnd.
-690.0 Tsnd.
-45.7%
1 Jan 2001 Jahr
730.0 Tsnd.
-90.0 Tsnd.
-10.98%
1 Jan 2002 Jahr
410.0 Tsnd.
-320.0 Tsnd.
-43.84%
1 Jan 2003 Jahr
300.0 Tsnd.
-110.0 Tsnd.
-26.83%
1 Jan 2004 Jahr
3.56 Mln.
+3.26 Mln.
1.09 Tsnd.%
1 Jan 2005 Jahr
1.1 Mln.
-2.46 Mln.
-69.1%
1 Jan 2006 Jahr
3.74 Mln.
+2.64 Mln.
240.0%
1 Jan 2007 Jahr
3.27 Mln.
-470.0 Tsnd.
-12.57%
1 Jan 2008 Jahr
6.94 Mln.
+3.67 Mln.
112.23%
1 Jan 2009 Jahr
12.75 Mln.
+5.81 Mln.
83.72%
1 Jan 2010 Jahr
14.3 Mln.
+1.55 Mln.
12.16%
1 Jan 2011 Jahr
9.11 Mln.
-5.19 Mln.
-36.29%
1 Jan 2012 Jahr
8.4 Mln.
-710.0 Tsnd.
-7.79%
1 Jan 2013 Jahr
1.95 Mln.
-6.45 Mln.
-76.79%
1 Jan 2014 Jahr
690.0 Tsnd.
-1.26 Mln.
-64.62%
1 Jan 2015 Jahr
730.0 Tsnd.
+40.0 Tsnd.
5.8%

Bewertung der Länder gemäß mit laufender Statistik nach Jahren