29
/de/
de
AIzaSyAYiBZKx7MnpbEhh9jyipgxe19OcubqV5w
April 1, 2024
130799
Ethiopia
ETH
true
2
1
Net bilateral aid flows from DAC donors, Greece (current US$)
2015,2014,2013,2012,2011,2010,2009,2008,2007,2006,2005,2004,2003,2002,2001,2000,1999,1998,1997
Diese Statistik in anderen Ländern:
AfghanistanAlbaniaAlgeriaAngolaAntigua and BarbudaArab WorldArgentinaArmeniaAzerbaijanBangladeshBarbadosBelarusBelizeBeninBhutanBoliviaBosnia and HerzegovinaBotswanaBrazilBulgariaBurkina FasoBurundiCabo VerdeCambodiaCameroonCaribbean small statesCentral African RepublicCentral Europe and the BalticsChadChileChinaColombiaComorosCongo, Dem. Rep.Congo, Rep.Costa RicaCote d'IvoireCroatiaCubaCyprusCzech RepublicDjiboutiDominicaDominican RepublicEast Asia & PacificEast Asia & Pacific (excluding high income)East Asia & Pacific (IDA & IBRD countries)EcuadorEgypt, Arab Rep.El SalvadorEquatorial GuineaEritreaEstoniaEthiopiaEuro areaEurope & Central AsiaEurope & Central Asia (excluding high income)Europe & Central Asia (IDA & IBRD countries)European UnionFijiFragile and conflict affected situationsGabonGambia, TheGeorgiaGhanaGrenadaGuatemalaGuineaGuinea-BissauGuyanaHaitiHeavily indebted poor countries (HIPC)High incomeHondurasHungaryIBRD onlyIDA & IBRD totalIDA blendIDA onlyIDA totalIndiaIndonesiaIran, Islamic Rep.IraqIsraelJamaicaJordanKazakhstanKenyaKiribatiKorea, Dem. People’s Rep.Korea, Rep.KosovoKyrgyz RepublicLao PDRLatin America & Caribbean Latin America & Caribbean (excluding high income)Latin America & the Caribbean (IDA & IBRD countries)LatviaLeast developed countries: UN classificationLebanonLesothoLiberiaLibyaLithuaniaLow & middle incomeLow incomeLower middle incomeMacedonia, FYRMadagascarMalawiMaldivesMaliMaltaMarshall IslandsMauritaniaMauritiusMexicoMicronesia, Fed. Sts.Middle East & North AfricaMiddle East & North Africa (excluding high income)Middle East & North Africa (IDA & IBRD countries)Middle incomeMoldovaMongoliaMontenegroMoroccoMozambiqueMyanmarNamibiaNauruNepalNicaraguaNigerNigeriaOECD membersOmanOther small statesPacific island small statesPakistanPalauPanamaPapua New GuineaPeruPhilippinesPolandRomaniaRussian FederationRwandaSamoaSao Tome and PrincipeSaudi ArabiaSenegalSerbiaSeychellesSierra LeoneSlovak RepublicSloveniaSmall statesSolomon IslandsSomaliaSouth AfricaSouth AsiaSouth Asia (IDA & IBRD)Sri LankaSt. Kitts and NevisSt. LuciaSt. Vincent and the GrenadinesSub-Saharan Africa Sub-Saharan Africa (excluding high income)Sub-Saharan Africa (IDA & IBRD countries)SudanSurinameSwazilandSyrian Arab RepublicTajikistanTanzaniaThailandTimor-LesteTogoTongaTrinidad and TobagoTunisiaTurkeyTurkmenistanTuvaluUgandaUkraineUpper middle incomeUruguayUzbekistanVanuatuVenezuela, RBVietnamWest Bank and GazaWorldYemen, Rep.ZambiaZimbabwe Zeitlinie:
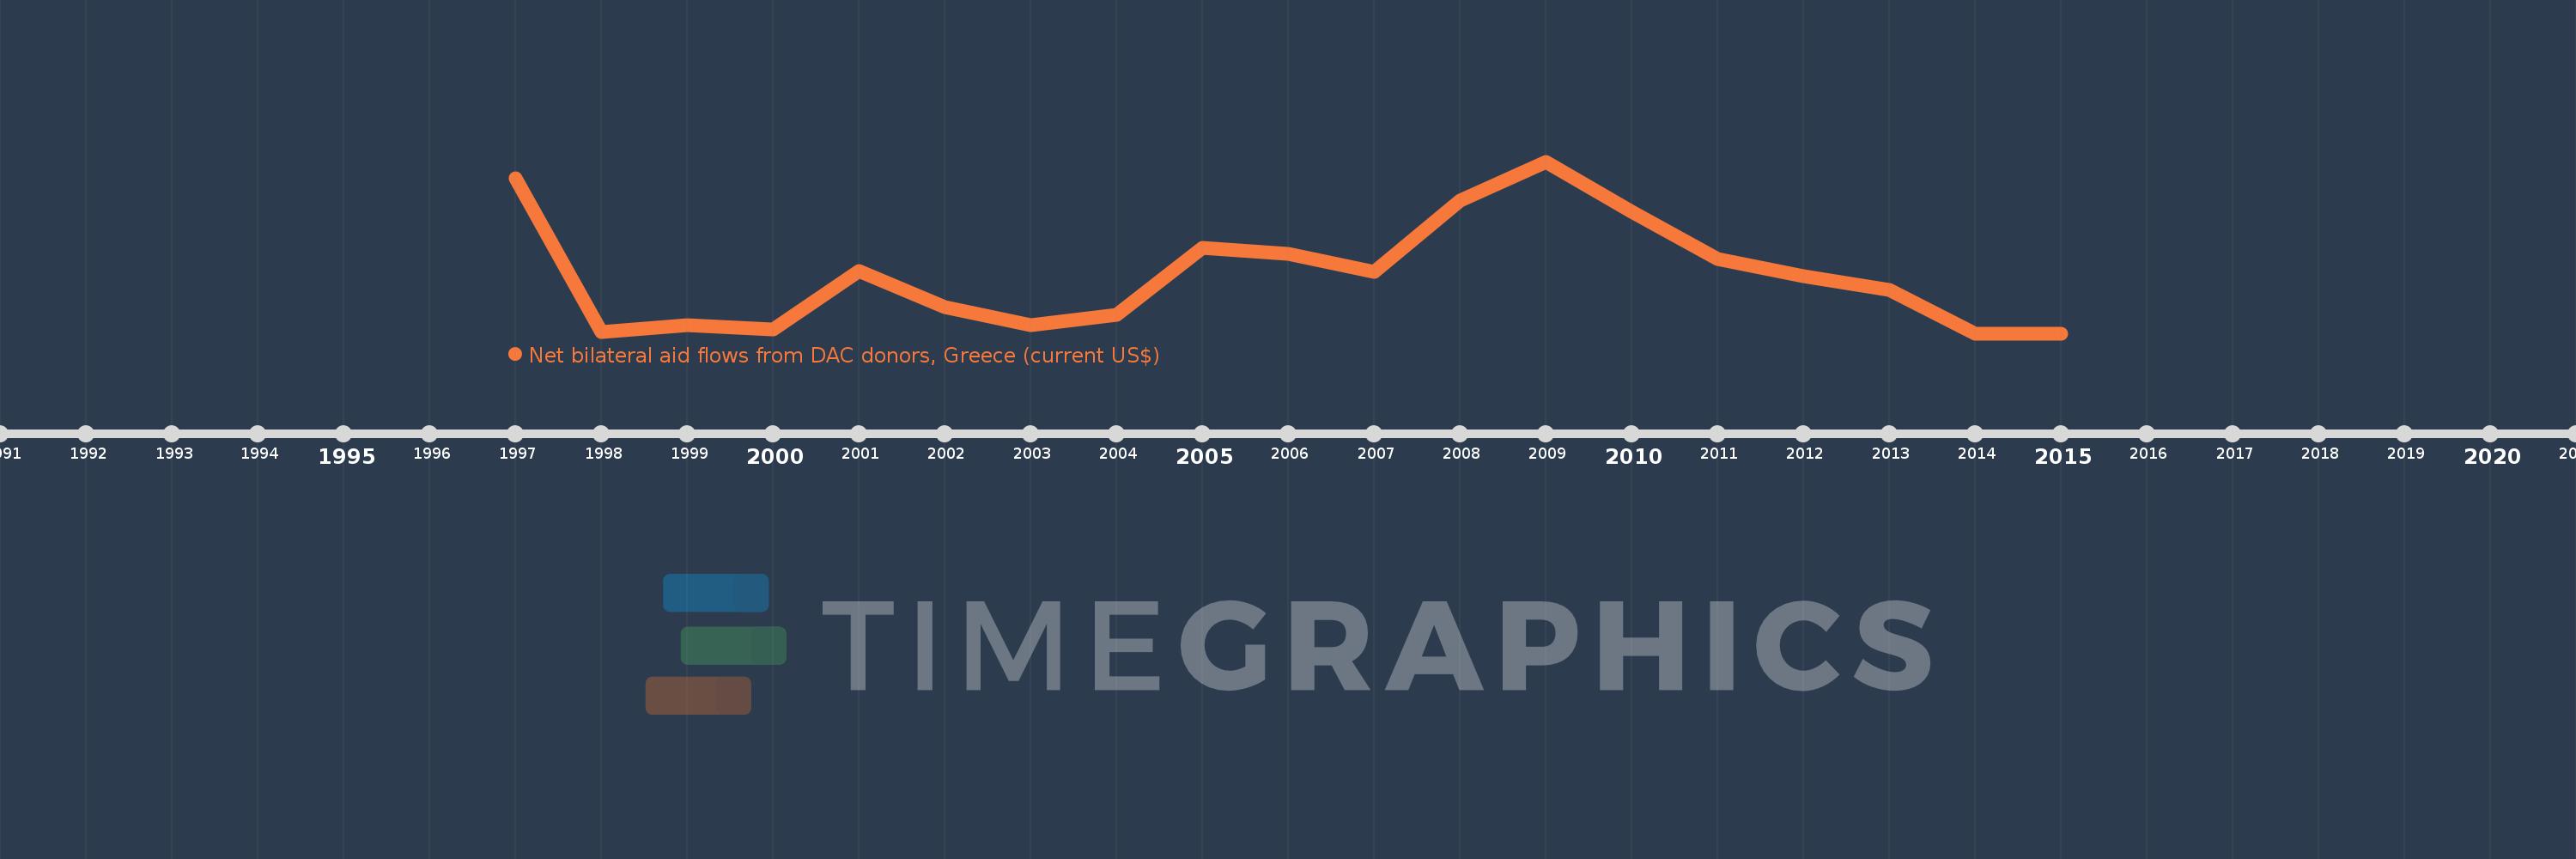
Diese Zeitleiste vorliegt die Graphik ab 1997 J. bis 2015 J. Ethiopia. Die Angaben bis 1996 J. sind nicht vorhanden. Die Zahl aktueller Beobachtungen nach Daten: 19.
Die Quelle (Bezeichnung):
Kennzahlen der Weltentwicklung
Die Quelle (Einrichtung):
Development Assistance Committee of the Organisation for Economic Co-operation and Development, Geographical Distribution of Financial Flows to Developing Countries, Development Co-operation Report, and International Development Statistics database. Data are available online at: www.oecd.org/dac/stats/idsonline.
Kategorien:
Aid Effectiveness
Es wurde aktualisiert:
23 Apr 2017 Jahr
Kennzahlen der Wertänderungen vom Jahr zum Jahr
im Durchschnitt:
1.119 Mln.
Minimum:
90.0 Tsnd.
1 Jan 2014 Jahr
Maximum:
3.11 Mln.
1 Jan 2009 Jahr
Zum Datum der Beobachtung
Wert
Absolute Veränderung
Die Veränderung bezüglich dem vorherigen Wert
1 Jan 1997 Jahr
2.82 Mln.
+2.82 Mln.
0.0%
1 Jan 1998 Jahr
110.0 Tsnd.
-2.71 Mln.
-96.1%
1 Jan 1999 Jahr
240.0 Tsnd.
+130.0 Tsnd.
118.18%
1 Jan 2000 Jahr
160.0 Tsnd.
-80.0 Tsnd.
-33.33%
1 Jan 2001 Jahr
1.19 Mln.
+1.03 Mln.
643.75%
1 Jan 2002 Jahr
550.0 Tsnd.
-640.0 Tsnd.
-53.78%
1 Jan 2003 Jahr
230.0 Tsnd.
-320.0 Tsnd.
-58.18%
1 Jan 2004 Jahr
420.0 Tsnd.
+190.0 Tsnd.
82.61%
1 Jan 2005 Jahr
1.59 Mln.
+1.17 Mln.
278.57%
1 Jan 2006 Jahr
1.49 Mln.
-100.0 Tsnd.
-6.29%
1 Jan 2007 Jahr
1.17 Mln.
-320.0 Tsnd.
-21.48%
1 Jan 2008 Jahr
2.43 Mln.
+1.26 Mln.
107.69%
1 Jan 2009 Jahr
3.11 Mln.
+680.0 Tsnd.
27.98%
1 Jan 2010 Jahr
2.23 Mln.
-880.0 Tsnd.
-28.3%
1 Jan 2011 Jahr
1.39 Mln.
-840.0 Tsnd.
-37.67%
1 Jan 2012 Jahr
1.1 Mln.
-290.0 Tsnd.
-20.86%
1 Jan 2013 Jahr
850.0 Tsnd.
-250.0 Tsnd.
-22.73%
1 Jan 2014 Jahr
90.0 Tsnd.
-760.0 Tsnd.
-89.41%
1 Jan 2015 Jahr
90.0 Tsnd.
0.0
0.0%
Bewertung der Länder gemäß mit laufender Statistik nach Jahren
Kommentare: