33
/de/
AIzaSyAYiBZKx7MnpbEhh9jyipgxe19OcubqV5w
August 1, 2025
184209
Macedonia, FYR
MKD
true
2
1
Net bilateral aid flows from DAC donors, Greece (current US$)
2015,2014,2013,2012,2011,2010,2009,2008,2007,2006,2005,2004,2003,2002,2001,2000,1999,1998,1997
Download
Bibliothek der Globalstatistik →Macedonia, FYR →

Net bilateral aid flows from DAC donors, Greece (current US$)

Diese Statistik in anderen Ländern:

AfghanistanAlbaniaAlgeriaAngolaAntigua and BarbudaArab WorldArgentinaArmeniaAzerbaijanBangladeshBarbadosBelarusBelizeBeninBhutanBoliviaBosnia and HerzegovinaBotswanaBrazilBulgariaBurkina FasoBurundiCabo VerdeCambodiaCameroonCaribbean small statesCentral African RepublicCentral Europe and the BalticsChadChileChinaColombiaComorosCongo, Dem. Rep.Congo, Rep.Costa RicaCote d'IvoireCroatiaCubaCyprusCzech RepublicDjiboutiDominicaDominican RepublicEast Asia & PacificEast Asia & Pacific (excluding high income)East Asia & Pacific (IDA & IBRD countries)EcuadorEgypt, Arab Rep.El SalvadorEquatorial GuineaEritreaEstoniaEthiopiaEuro areaEurope & Central AsiaEurope & Central Asia (excluding high income)Europe & Central Asia (IDA & IBRD countries)European UnionFijiFragile and conflict affected situationsGabonGambia, TheGeorgiaGhanaGrenadaGuatemalaGuineaGuinea-BissauGuyanaHaitiHeavily indebted poor countries (HIPC)High incomeHondurasHungaryIBRD onlyIDA & IBRD totalIDA blendIDA onlyIDA totalIndiaIndonesiaIran, Islamic Rep.IraqIsraelJamaicaJordanKazakhstanKenyaKiribatiKorea, Dem. People’s Rep.Korea, Rep.KosovoKyrgyz RepublicLao PDRLatin America & Caribbean Latin America & Caribbean (excluding high income)Latin America & the Caribbean (IDA & IBRD countries)LatviaLeast developed countries: UN classificationLebanonLesothoLiberiaLibyaLithuaniaLow & middle incomeLow incomeLower middle incomeMacedonia, FYRMadagascarMalawiMaldivesMaliMaltaMarshall IslandsMauritaniaMauritiusMexicoMicronesia, Fed. Sts.Middle East & North AfricaMiddle East & North Africa (excluding high income)Middle East & North Africa (IDA & IBRD countries)Middle incomeMoldovaMongoliaMontenegroMoroccoMozambiqueMyanmarNamibiaNauruNepalNicaraguaNigerNigeriaOECD membersOmanOther small statesPacific island small statesPakistanPalauPanamaPapua New GuineaPeruPhilippinesPolandRomaniaRussian FederationRwandaSamoaSao Tome and PrincipeSaudi ArabiaSenegalSerbiaSeychellesSierra LeoneSlovak RepublicSloveniaSmall statesSolomon IslandsSomaliaSouth AfricaSouth AsiaSouth Asia (IDA & IBRD)Sri LankaSt. Kitts and NevisSt. LuciaSt. Vincent and the GrenadinesSub-Saharan Africa Sub-Saharan Africa (excluding high income)Sub-Saharan Africa (IDA & IBRD countries)SudanSurinameSwazilandSyrian Arab RepublicTajikistanTanzaniaThailandTimor-LesteTogoTongaTrinidad and TobagoTunisiaTurkeyTurkmenistanTuvaluUgandaUkraineUpper middle incomeUruguayUzbekistanVanuatuVenezuela, RBVietnamWest Bank and GazaWorldYemen, Rep.ZambiaZimbabwe

Zeitlinie:

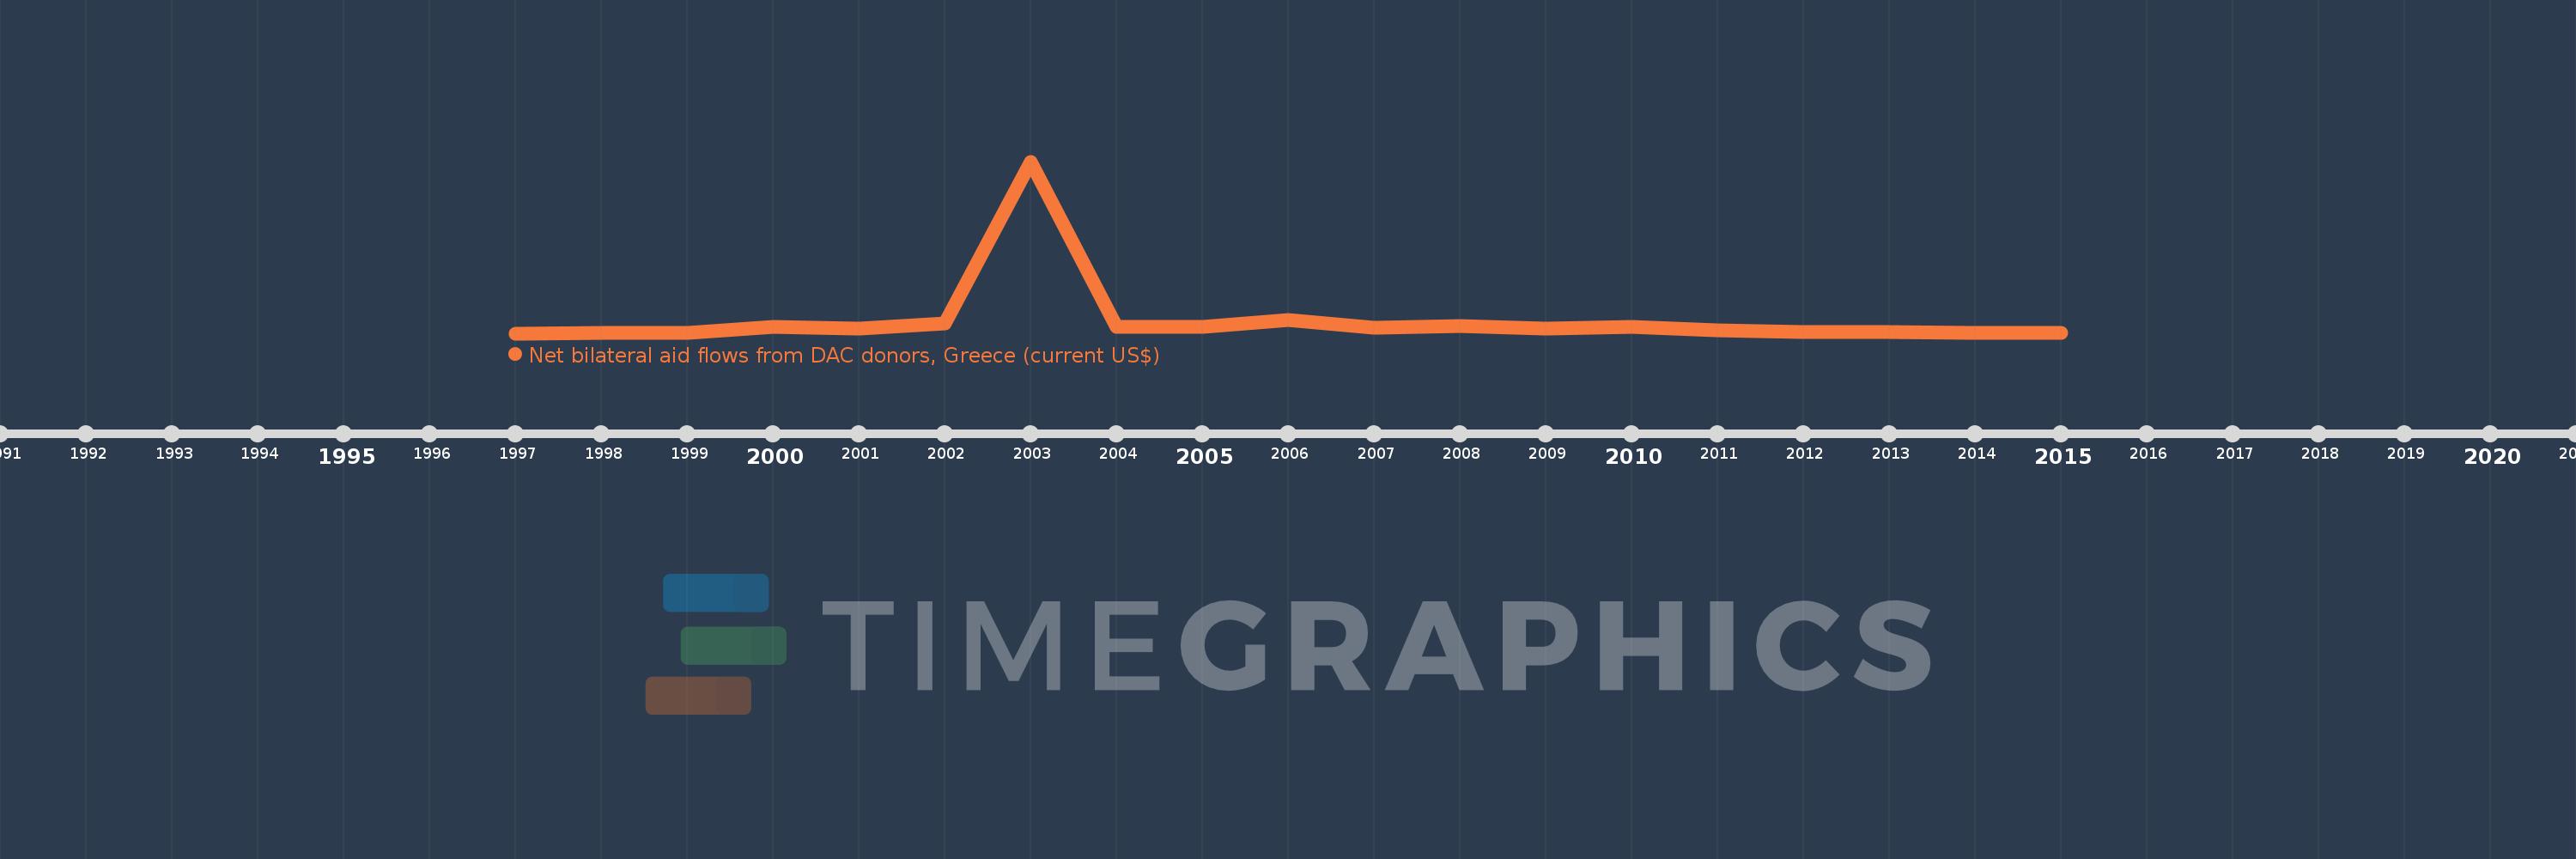
Diese Zeitleiste vorliegt die Graphik ab 1997 J. bis 2015 J. Macedonia, FYR. Die Angaben bis 1996 J. sind nicht vorhanden. Die Zahl aktueller Beobachtungen nach Daten: 19.

Die Quelle (Bezeichnung):

Kennzahlen der Weltentwicklung

Die Quelle (Einrichtung):

Development Assistance Committee of the Organisation for Economic Co-operation and Development, Geographical Distribution of Financial Flows to Developing Countries, Development Co-operation Report, and International Development Statistics database. Data are available online at: www.oecd.org/dac/stats/idsonline.

Kategorien:

Aid Effectiveness

Es wurde aktualisiert:

23 Apr 2017 Jahr

Kennzahlen der Wertänderungen vom Jahr zum Jahr

im Durchschnitt:
3.712 Mln.
Minimum:
140.0 Tsnd.
1 Jan 1997 Jahr
Maximum:
46.78 Mln.
1 Jan 2003 Jahr
Zum Datum der Beobachtung
Wert
Absolute Veränderung
Die Veränderung bezüglich dem vorherigen Wert
1 Jan 1997 Jahr
140.0 Tsnd.
+140.0 Tsnd.
0.0%
1 Jan 1998 Jahr
230.0 Tsnd.
+90.0 Tsnd.
64.29%
1 Jan 1999 Jahr
310.0 Tsnd.
+80.0 Tsnd.
34.78%
1 Jan 2000 Jahr
1.89 Mln.
+1.58 Mln.
509.68%
1 Jan 2001 Jahr
1.38 Mln.
-510.0 Tsnd.
-26.98%
1 Jan 2002 Jahr
2.75 Mln.
+1.37 Mln.
99.28%
1 Jan 2003 Jahr
46.78 Mln.
+44.03 Mln.
1.6 Tsnd.%
1 Jan 2004 Jahr
1.89 Mln.
-44.89 Mln.
-95.96%
1 Jan 2005 Jahr
1.78 Mln.
-110.0 Tsnd.
-5.82%
1 Jan 2006 Jahr
3.69 Mln.
+1.91 Mln.
107.3%
1 Jan 2007 Jahr
1.68 Mln.
-2.01 Mln.
-54.47%
1 Jan 2008 Jahr
2.06 Mln.
+380.0 Tsnd.
22.62%
1 Jan 2009 Jahr
1.51 Mln.
-550.0 Tsnd.
-26.7%
1 Jan 2010 Jahr
1.97 Mln.
+460.0 Tsnd.
30.46%
1 Jan 2011 Jahr
890.0 Tsnd.
-1.08 Mln.
-54.82%
1 Jan 2012 Jahr
570.0 Tsnd.
-320.0 Tsnd.
-35.96%
1 Jan 2013 Jahr
450.0 Tsnd.
-120.0 Tsnd.
-21.05%
1 Jan 2014 Jahr
250.0 Tsnd.
-200.0 Tsnd.
-44.44%
1 Jan 2015 Jahr
310.0 Tsnd.
+60.0 Tsnd.
24.0%

Bewertung der Länder gemäß mit laufender Statistik nach Jahren