29
/
en
AIzaSyAYiBZKx7MnpbEhh9jyipgxe19OcubqV5w
April 1, 2024
98512
Cambodia
KHM
true
2
1
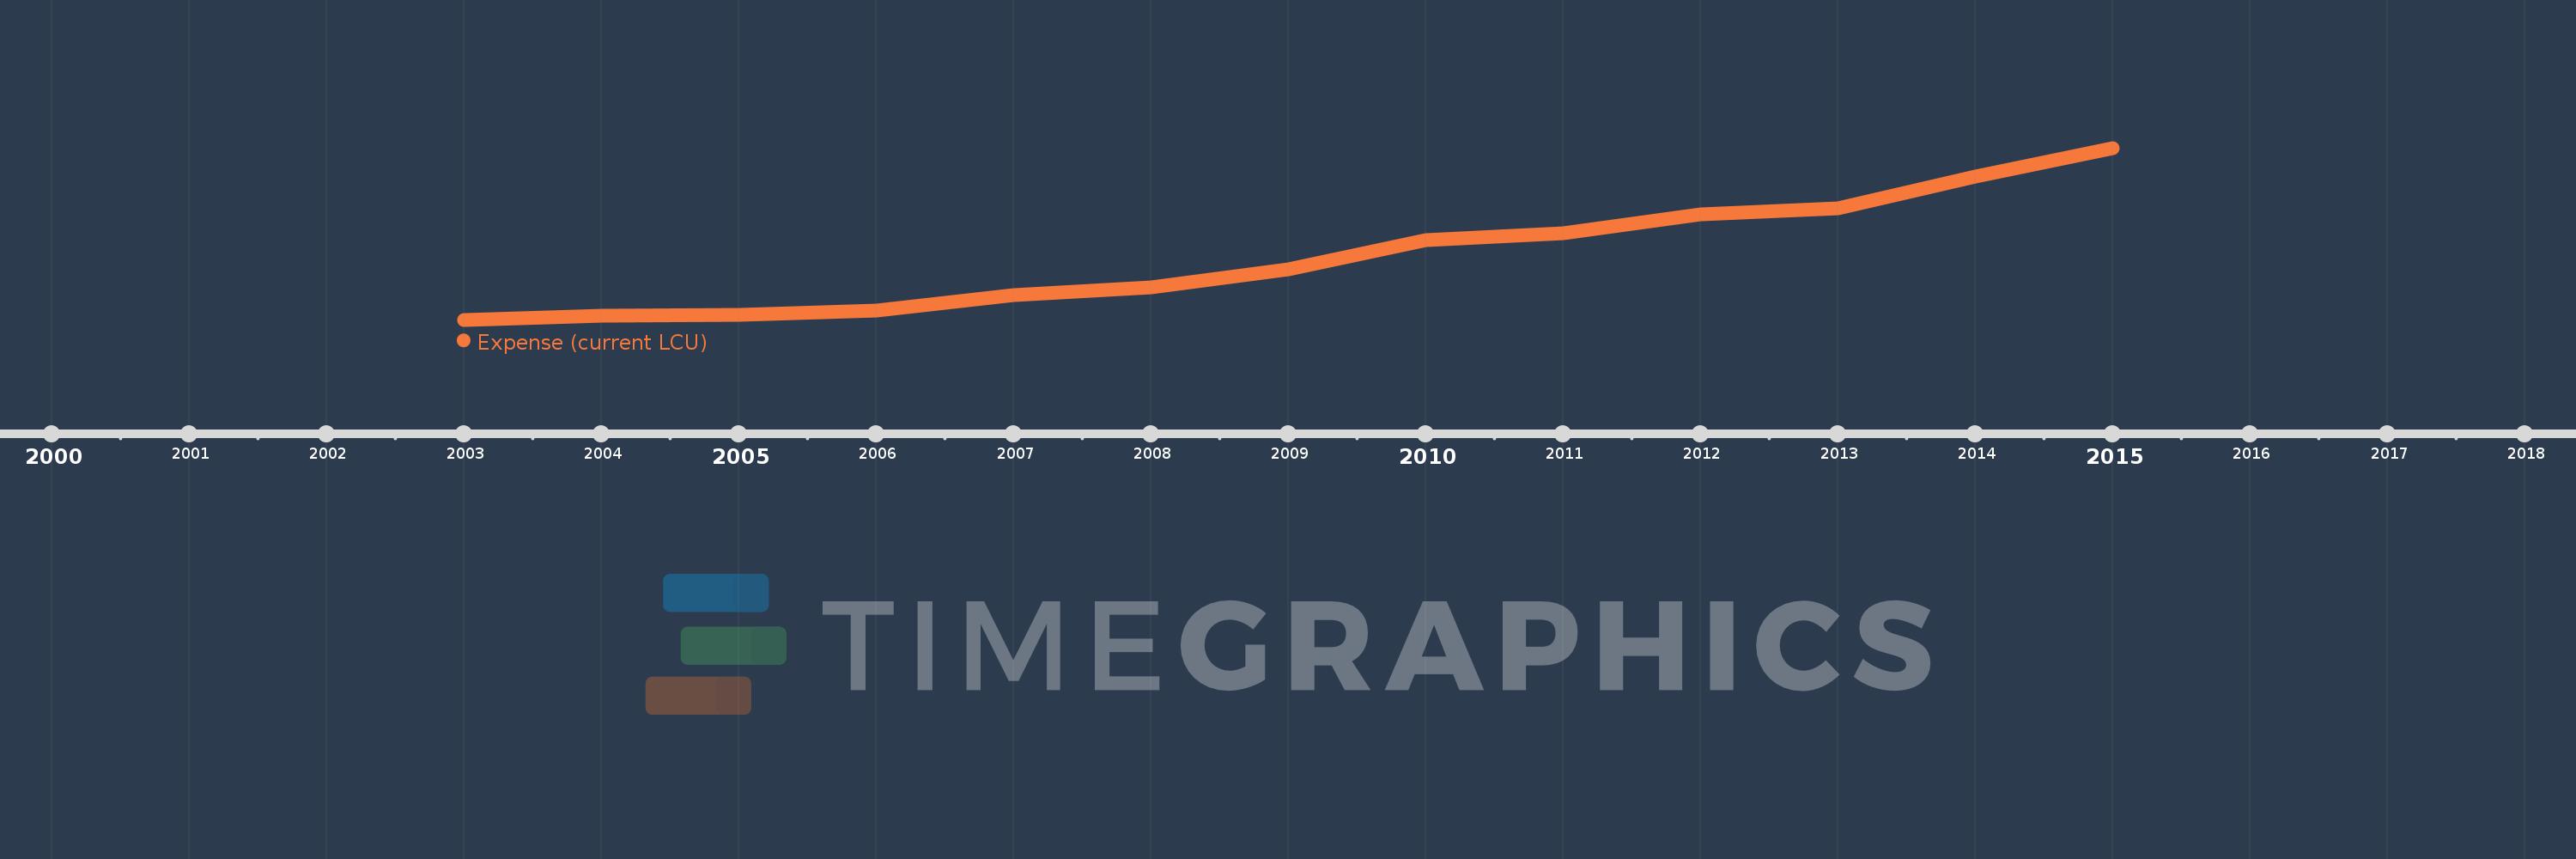
Expense (current LCU)
2015,2014,2013,2012,2011,2010,2009,2008,2007,2006,2005,2004,2003
This statistics in other country:
AfghanistanAlbaniaAlgeriaAngolaAntigua and BarbudaArmeniaAustraliaAustriaAzerbaijanBahamas, TheBahrainBangladeshBarbadosBelarusBelgiumBelizeBeninBhutanBoliviaBosnia and HerzegovinaBotswanaBrazilBulgariaBurkina FasoBurundiCabo VerdeCambodiaCanadaCentral African RepublicChileColombiaCongo, Dem. Rep.Congo, Rep.Costa RicaCote d'IvoireCroatiaCyprusCzech RepublicDenmarkDominicaDominican RepublicEgypt, Arab Rep.El SalvadorEquatorial GuineaEstoniaEthiopiaFijiFinlandFranceGambia, TheGeorgiaGermanyGhanaGreeceGrenadaGuatemalaHondurasHong Kong SAR, ChinaHungaryIcelandIndiaIndonesiaIran, Islamic Rep.IraqIrelandIsraelItalyJamaicaJapanJordanKazakhstanKenyaKiribatiKorea, Rep.KuwaitKyrgyz RepublicLao PDRLatviaLebanonLesothoLiberiaLithuaniaLuxembourgMacao SAR, ChinaMacedonia, FYRMadagascarMalawiMalaysiaMaldivesMaliMaltaMauritiusMexicoMicronesia, Fed. Sts.MoldovaMongoliaMoroccoMozambiqueMyanmarNamibiaNepalNetherlandsNew ZealandNicaraguaNigeriaNorwayOmanPakistanPanamaPapua New GuineaParaguayPeruPhilippinesPolandPortugalQatarRomaniaRussian FederationRwandaSamoaSan MarinoSao Tome and PrincipeSenegalSerbiaSeychellesSierra LeoneSingaporeSlovak RepublicSloveniaSolomon IslandsSouth AfricaSpainSri LankaSt. Kitts and NevisSt. LuciaSurinameSwazilandSwedenSwitzerlandSyrian Arab RepublicTajikistanTanzaniaThailandTimor-LesteTogoTrinidad and TobagoTunisiaTurkeyUgandaUkraineUnited Arab EmiratesUnited KingdomUnited StatesUruguayVanuatuVenezuela, RBVietnamWest Bank and GazaYemen, Rep.ZambiaZimbabwe Timeline:
This timeline shows a graph from 2003 to 2015 of Cambodia. No data until 2002. Number of actual observations by date: 13.
Source name:
World Development Indicators
Source organization:
International Monetary Fund, Government Finance Statistics Yearbook and data files.
Categories, topics:
Public Sector
Last updated:
apr 23, 2017
Indicators value changes by year
Minimum:
1.574 trl
jan 1, 2003
Maximum:
8.398 trl
jan 1, 2015
At the date of observation
Value
Absolute change
Change from previous value
jan 1, 2003
1.574 trl
+1.574 trl
0.0%
jan 1, 2004
1.722 trl
+147.995 bln
9.4%
jan 1, 2005
1.754 trl
+31.551 bln
1.83%
jan 1, 2006
1.955 trl
+201.317 bln
11.48%
jan 1, 2007
2.563 trl
+608.185 bln
31.11%
jan 1, 2008
2.874 trl
+310.702 bln
12.12%
jan 1, 2009
3.593 trl
+718.68 bln
25.01%
jan 1, 2010
4.721 trl
+1.129 trl
31.42%
jan 1, 2011
5.003 trl
+281.029 bln
5.95%
jan 1, 2012
5.754 trl
+751.824 bln
15.03%
jan 1, 2013
5.993 trl
+238.81 bln
4.15%
jan 1, 2014
7.274 trl
+1.281 trl
21.38%
jan 1, 2015
8.398 trl
+1.123 trl
15.44%
Ranking of countries by current statistics by years


Comments: