29
/
en
AIzaSyAYiBZKx7MnpbEhh9jyipgxe19OcubqV5w
April 1, 2024
176311
Lebanon
LBN
true
2
1
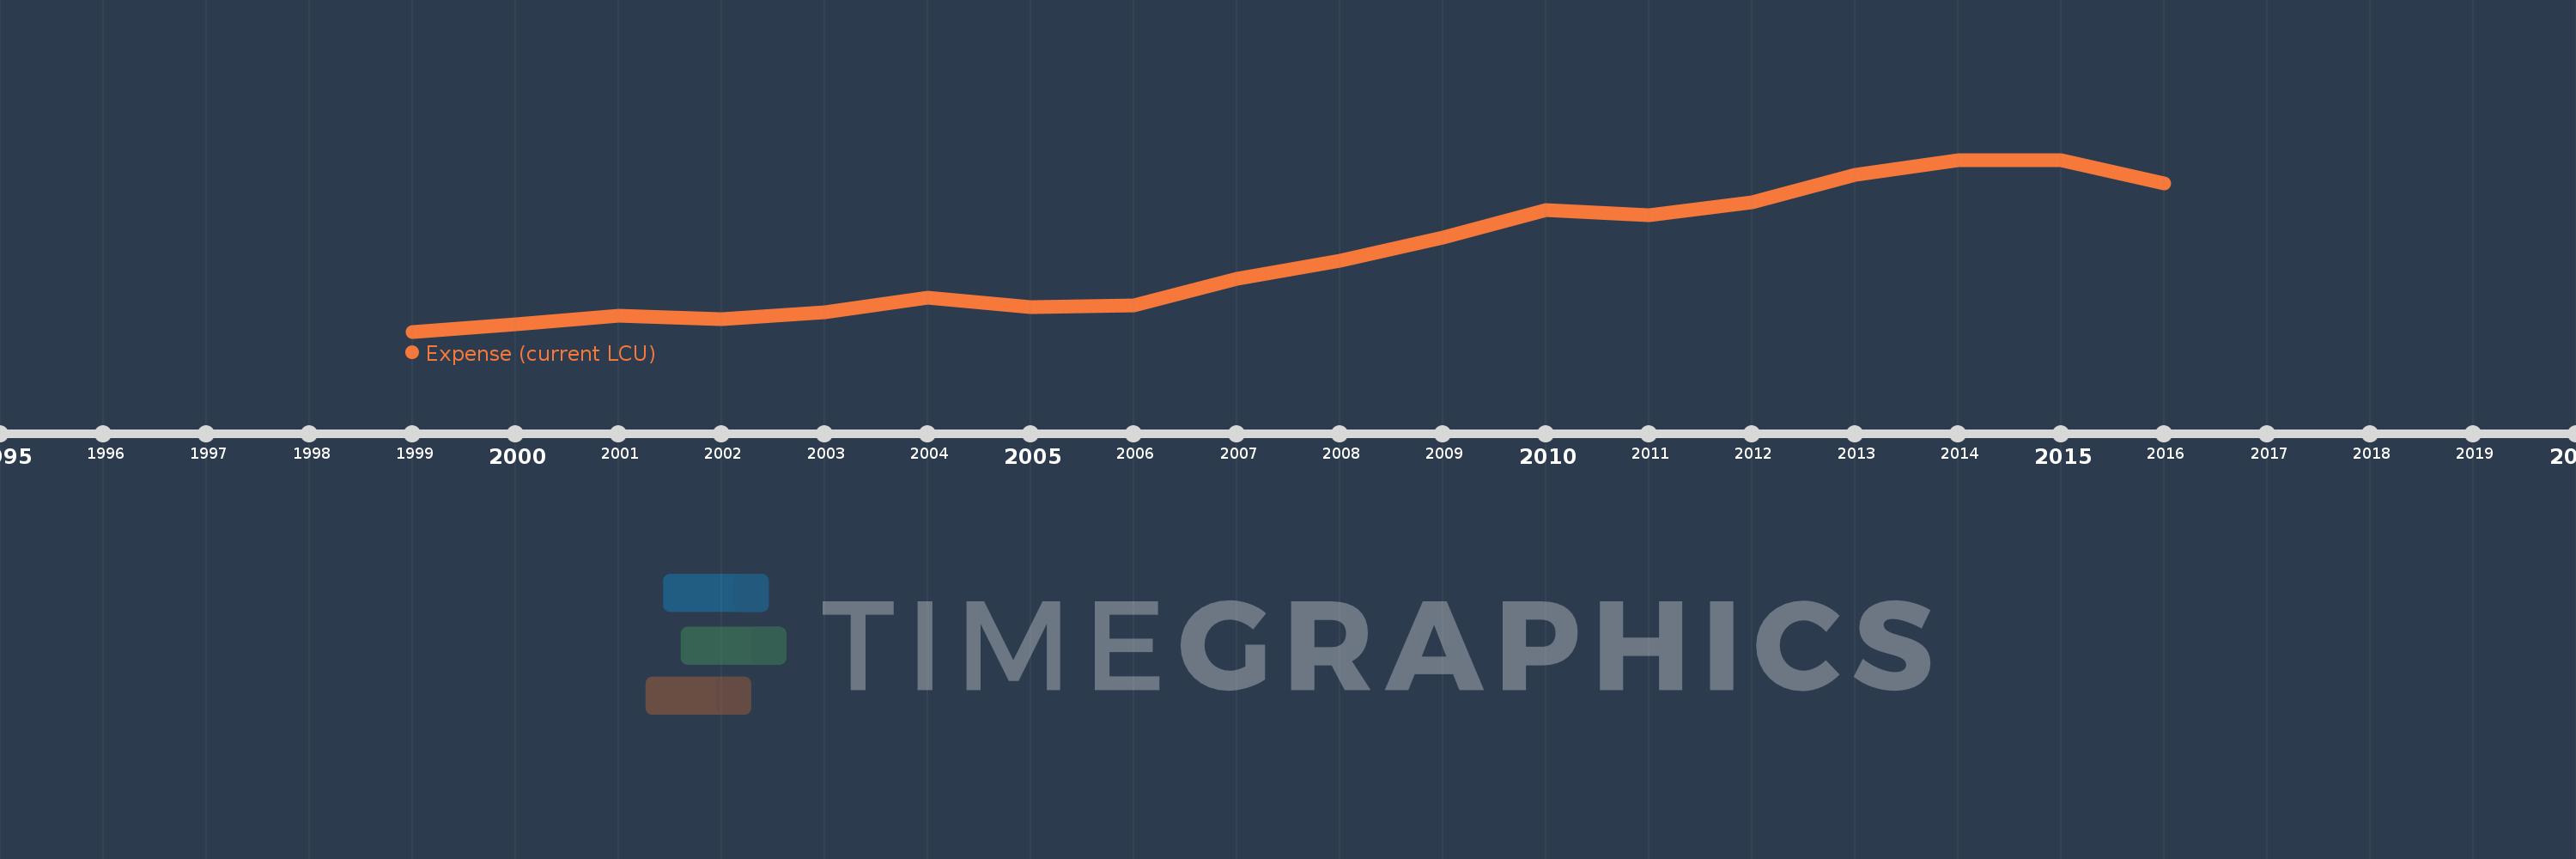
Expense (current LCU)
2016,2015,2014,2013,2012,2011,2010,2009,2008,2007,2006,2005,2004,2003,2002,2001,2000,1999
This statistics in other country:
AfghanistanAlbaniaAlgeriaAngolaAntigua and BarbudaArmeniaAustraliaAustriaAzerbaijanBahamas, TheBahrainBangladeshBarbadosBelarusBelgiumBelizeBeninBhutanBoliviaBosnia and HerzegovinaBotswanaBrazilBulgariaBurkina FasoBurundiCabo VerdeCambodiaCanadaCentral African RepublicChileColombiaCongo, Dem. Rep.Congo, Rep.Costa RicaCote d'IvoireCroatiaCyprusCzech RepublicDenmarkDominicaDominican RepublicEgypt, Arab Rep.El SalvadorEquatorial GuineaEstoniaEthiopiaFijiFinlandFranceGambia, TheGeorgiaGermanyGhanaGreeceGrenadaGuatemalaHondurasHong Kong SAR, ChinaHungaryIcelandIndiaIndonesiaIran, Islamic Rep.IraqIrelandIsraelItalyJamaicaJapanJordanKazakhstanKenyaKiribatiKorea, Rep.KuwaitKyrgyz RepublicLao PDRLatviaLebanonLesothoLiberiaLithuaniaLuxembourgMacao SAR, ChinaMacedonia, FYRMadagascarMalawiMalaysiaMaldivesMaliMaltaMauritiusMexicoMicronesia, Fed. Sts.MoldovaMongoliaMoroccoMozambiqueMyanmarNamibiaNepalNetherlandsNew ZealandNicaraguaNigeriaNorwayOmanPakistanPanamaPapua New GuineaParaguayPeruPhilippinesPolandPortugalQatarRomaniaRussian FederationRwandaSamoaSan MarinoSao Tome and PrincipeSenegalSerbiaSeychellesSierra LeoneSingaporeSlovak RepublicSloveniaSolomon IslandsSouth AfricaSpainSri LankaSt. Kitts and NevisSt. LuciaSurinameSwazilandSwedenSwitzerlandSyrian Arab RepublicTajikistanTanzaniaThailandTimor-LesteTogoTrinidad and TobagoTunisiaTurkeyUgandaUkraineUnited Arab EmiratesUnited KingdomUnited StatesUruguayVanuatuVenezuela, RBVietnamWest Bank and GazaYemen, Rep.ZambiaZimbabwe Timeline:
This timeline shows a graph from 1999 to 2016 of Lebanon. No data until 1998. Number of actual observations by date: 18.
Source name:
World Development Indicators
Source organization:
International Monetary Fund, Government Finance Statistics Yearbook and data files.
Categories, topics:
Public Sector
Last updated:
apr 23, 2017
Indicators value changes by year
Minimum:
6.845 trl
jan 1, 1999
Maximum:
18.864 trl
jan 1, 2014
At the date of observation
Value
Absolute change
Change from previous value
jan 1, 1999
6.845 trl
+6.845 trl
0.0%
jan 1, 2000
7.357 trl
+511.54 bln
7.47%
jan 1, 2001
7.939 trl
+581.9 bln
7.91%
jan 1, 2002
7.718 trl
-220.4 bln
-2.78%
jan 1, 2003
8.186 trl
+467.3 bln
6.05%
jan 1, 2004
9.225 trl
+1.04 trl
12.7%
jan 1, 2005
8.563 trl
-661.978 bln
-7.18%
jan 1, 2006
8.699 trl
+135.892 bln
1.59%
jan 1, 2007
10.528 trl
+1.829 trl
21.02%
jan 1, 2008
11.816 trl
+1.288 trl
12.23%
jan 1, 2009
13.41 trl
+1.594 trl
13.49%
jan 1, 2010
15.361 trl
+1.951 trl
14.55%
jan 1, 2011
14.977 trl
-383.918 bln
-2.5%
jan 1, 2012
15.888 trl
+911.1 bln
6.08%
jan 1, 2013
17.783 trl
+1.894 trl
11.92%
jan 1, 2014
18.864 trl
+1.081 trl
6.08%
jan 1, 2015
18.812 trl
-51.295 bln
-0.27%
jan 1, 2016
17.235 trl
-1.578 trl
-8.39%
Ranking of countries by current statistics by years


Comments: