29
/
en
AIzaSyAYiBZKx7MnpbEhh9jyipgxe19OcubqV5w
April 1, 2024
282212
Vietnam
VNM
true
2
1
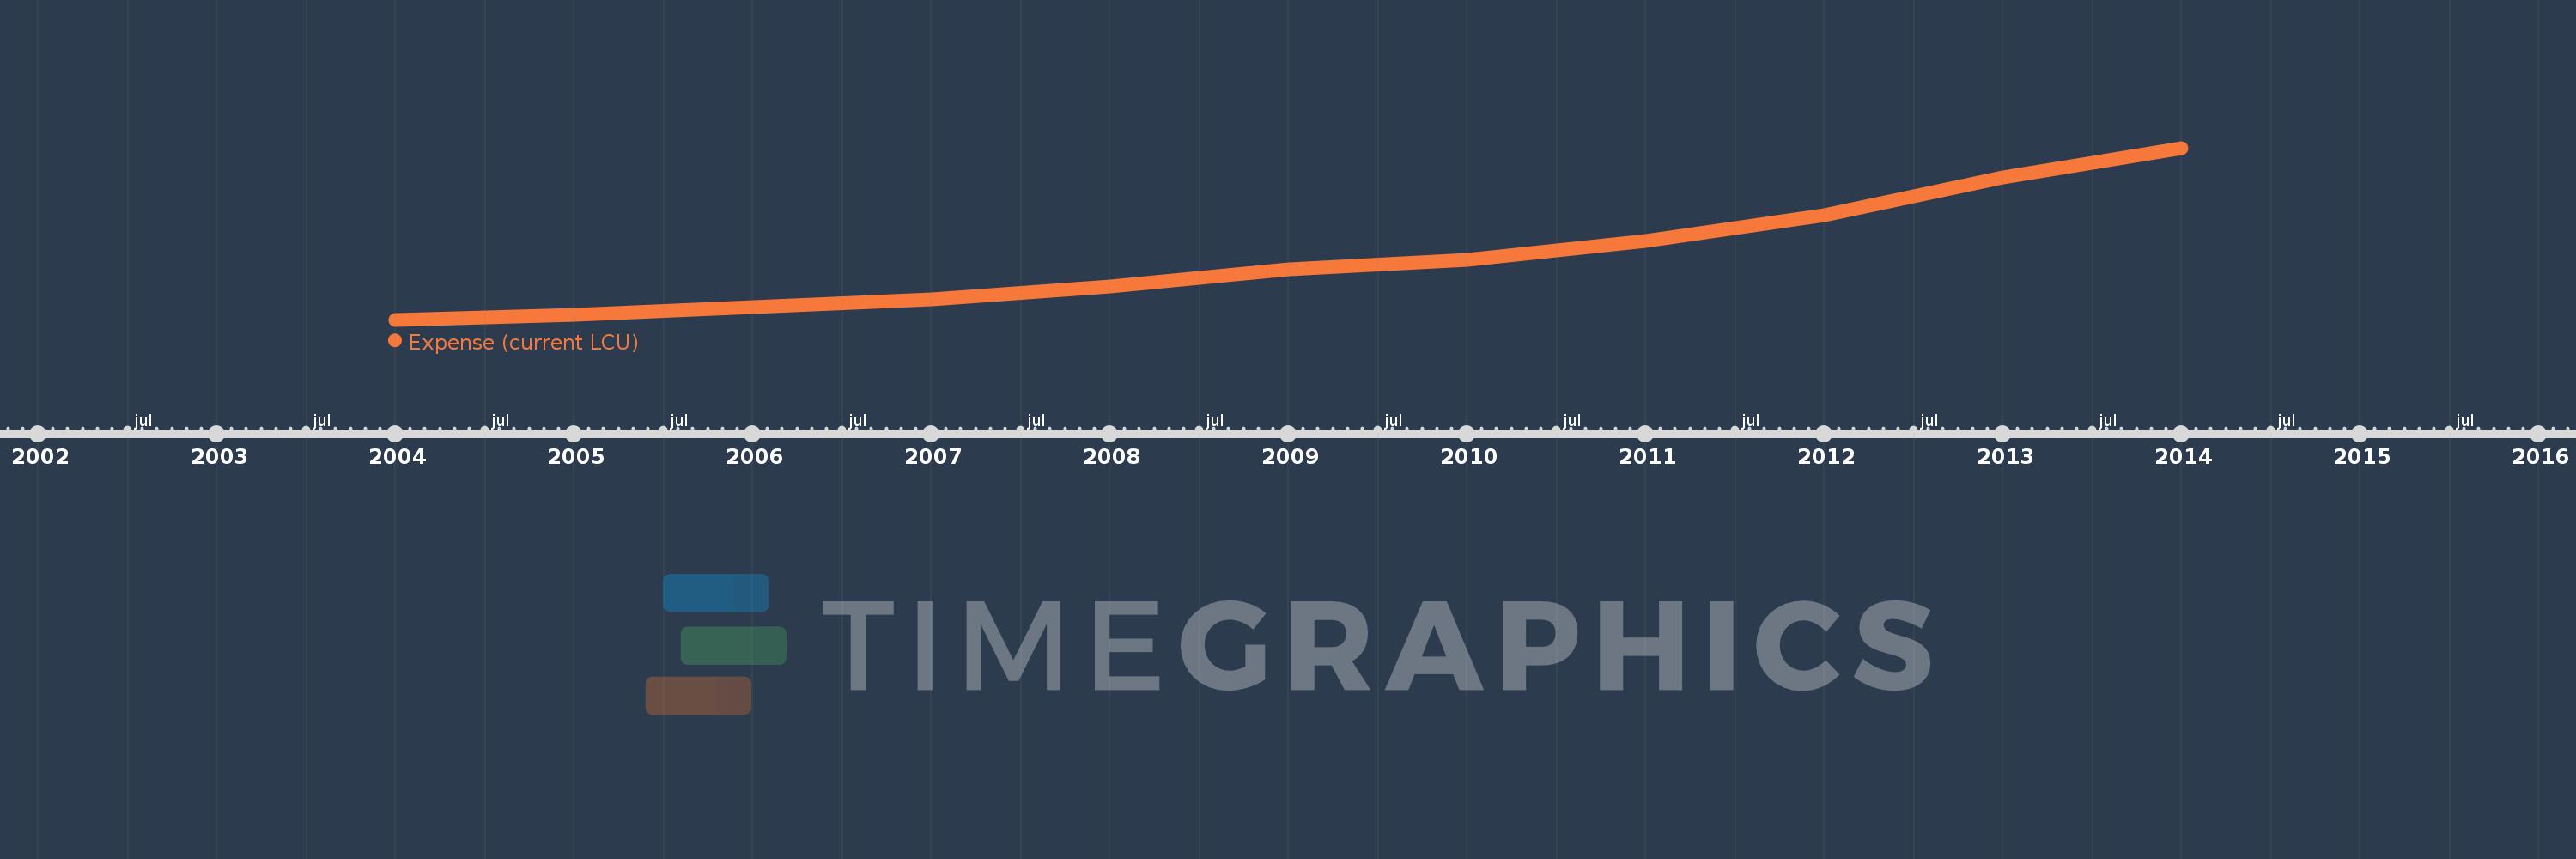
Expense (current LCU)
2014,2013,2012,2011,2010,2009,2008,2007,2006,2005,2004
This statistics in other country:
AfghanistanAlbaniaAlgeriaAngolaAntigua and BarbudaArmeniaAustraliaAustriaAzerbaijanBahamas, TheBahrainBangladeshBarbadosBelarusBelgiumBelizeBeninBhutanBoliviaBosnia and HerzegovinaBotswanaBrazilBulgariaBurkina FasoBurundiCabo VerdeCambodiaCanadaCentral African RepublicChileColombiaCongo, Dem. Rep.Congo, Rep.Costa RicaCote d'IvoireCroatiaCyprusCzech RepublicDenmarkDominicaDominican RepublicEgypt, Arab Rep.El SalvadorEquatorial GuineaEstoniaEthiopiaFijiFinlandFranceGambia, TheGeorgiaGermanyGhanaGreeceGrenadaGuatemalaHondurasHong Kong SAR, ChinaHungaryIcelandIndiaIndonesiaIran, Islamic Rep.IraqIrelandIsraelItalyJamaicaJapanJordanKazakhstanKenyaKiribatiKorea, Rep.KuwaitKyrgyz RepublicLao PDRLatviaLebanonLesothoLiberiaLithuaniaLuxembourgMacao SAR, ChinaMacedonia, FYRMadagascarMalawiMalaysiaMaldivesMaliMaltaMauritiusMexicoMicronesia, Fed. Sts.MoldovaMongoliaMoroccoMozambiqueMyanmarNamibiaNepalNetherlandsNew ZealandNicaraguaNigeriaNorwayOmanPakistanPanamaPapua New GuineaParaguayPeruPhilippinesPolandPortugalQatarRomaniaRussian FederationRwandaSamoaSan MarinoSao Tome and PrincipeSenegalSerbiaSeychellesSierra LeoneSingaporeSlovak RepublicSloveniaSolomon IslandsSouth AfricaSpainSri LankaSt. Kitts and NevisSt. LuciaSurinameSwazilandSwedenSwitzerlandSyrian Arab RepublicTajikistanTanzaniaThailandTimor-LesteTogoTrinidad and TobagoTunisiaTurkeyUgandaUkraineUnited Arab EmiratesUnited KingdomUnited StatesUruguayVanuatuVenezuela, RBVietnamWest Bank and GazaYemen, Rep.ZambiaZimbabwe Timeline:
This timeline shows a graph from 2004 to 2014 of Vietnam. No data until 2003. Number of actual observations by date: 11.
Source name:
World Development Indicators
Source organization:
International Monetary Fund, Government Finance Statistics Yearbook and data files.
Categories, topics:
Public Sector
Last updated:
apr 23, 2017
Indicators value changes by year
Minimum:
107.72 trl
jan 1, 2004
Maximum:
772.863 trl
jan 1, 2014
At the date of observation
Value
Absolute change
Change from previous value
jan 1, 2004
107.72 trl
+107.72 trl
0.0%
jan 1, 2005
125.607 trl
+17.887 trl
16.61%
jan 1, 2006
156.25 trl
+30.643 trl
24.4%
jan 1, 2007
187.332 trl
+31.082 trl
19.89%
jan 1, 2008
237.62 trl
+50.288 trl
26.84%
jan 1, 2009
301.751 trl
+64.131 trl
26.99%
jan 1, 2010
338.993 trl
+37.242 trl
12.34%
jan 1, 2011
413.966 trl
+74.973 trl
22.12%
jan 1, 2012
510.945 trl
+96.979 trl
23.43%
jan 1, 2013
659.23 trl
+148.285 trl
29.02%
jan 1, 2014
772.863 trl
+113.633 trl
17.24%
Ranking of countries by current statistics by years


Comments: