29
/
en
AIzaSyAYiBZKx7MnpbEhh9jyipgxe19OcubqV5w
April 1, 2024
258262
Syrian Arab Republic
SYR
true
2
1
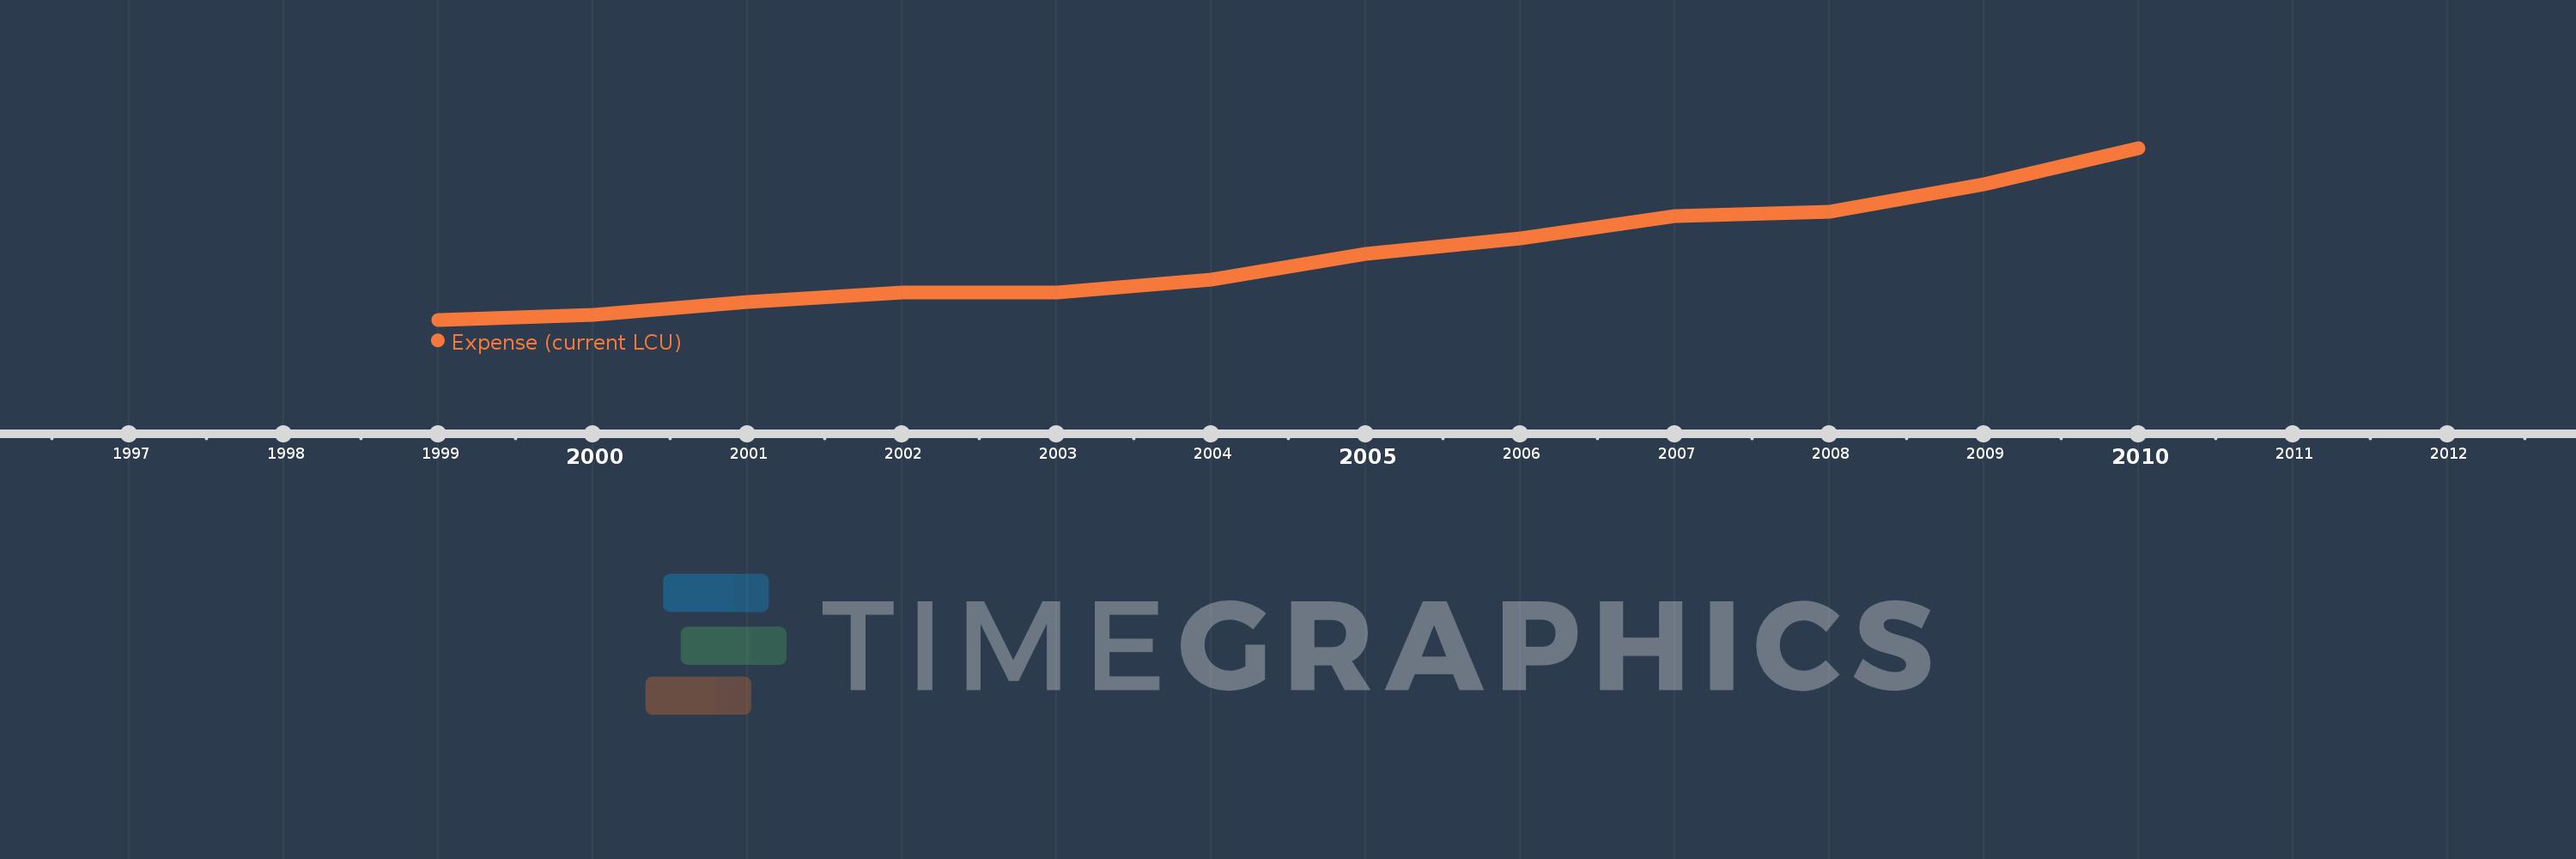
Expense (current LCU)
2010,2009,2008,2007,2006,2005,2004,2003,2002,2001,2000,1999
This statistics in other country:
AfghanistanAlbaniaAlgeriaAngolaAntigua and BarbudaArmeniaAustraliaAustriaAzerbaijanBahamas, TheBahrainBangladeshBarbadosBelarusBelgiumBelizeBeninBhutanBoliviaBosnia and HerzegovinaBotswanaBrazilBulgariaBurkina FasoBurundiCabo VerdeCambodiaCanadaCentral African RepublicChileColombiaCongo, Dem. Rep.Congo, Rep.Costa RicaCote d'IvoireCroatiaCyprusCzech RepublicDenmarkDominicaDominican RepublicEgypt, Arab Rep.El SalvadorEquatorial GuineaEstoniaEthiopiaFijiFinlandFranceGambia, TheGeorgiaGermanyGhanaGreeceGrenadaGuatemalaHondurasHong Kong SAR, ChinaHungaryIcelandIndiaIndonesiaIran, Islamic Rep.IraqIrelandIsraelItalyJamaicaJapanJordanKazakhstanKenyaKiribatiKorea, Rep.KuwaitKyrgyz RepublicLao PDRLatviaLebanonLesothoLiberiaLithuaniaLuxembourgMacao SAR, ChinaMacedonia, FYRMadagascarMalawiMalaysiaMaldivesMaliMaltaMauritiusMexicoMicronesia, Fed. Sts.MoldovaMongoliaMoroccoMozambiqueMyanmarNamibiaNepalNetherlandsNew ZealandNicaraguaNigeriaNorwayOmanPakistanPanamaPapua New GuineaParaguayPeruPhilippinesPolandPortugalQatarRomaniaRussian FederationRwandaSamoaSan MarinoSao Tome and PrincipeSenegalSerbiaSeychellesSierra LeoneSingaporeSlovak RepublicSloveniaSolomon IslandsSouth AfricaSpainSri LankaSt. Kitts and NevisSt. LuciaSurinameSwazilandSwedenSwitzerlandSyrian Arab RepublicTajikistanTanzaniaThailandTimor-LesteTogoTrinidad and TobagoTunisiaTurkeyUgandaUkraineUnited Arab EmiratesUnited KingdomUnited StatesUruguayVanuatuVenezuela, RBVietnamWest Bank and GazaYemen, Rep.ZambiaZimbabwe Timeline:
This timeline shows a graph from 1999 to 2010 of Syrian Arab Republic. No data until 1998. Number of actual observations by date: 12.
Source name:
World Development Indicators
Source organization:
International Monetary Fund, Government Finance Statistics Yearbook and data files.
Categories, topics:
Public Sector
Last updated:
apr 23, 2017
Indicators value changes by year
Minimum:
128.193 bln
jan 1, 1999
Maximum:
442.18 bln
jan 1, 2010
At the date of observation
Value
Absolute change
Change from previous value
jan 1, 1999
128.193 bln
+128.193 bln
0.0%
jan 1, 2000
136.971 bln
+8.778 bln
6.85%
jan 1, 2001
160.89 bln
+23.919 bln
17.46%
jan 1, 2002
178.122 bln
+17.232 bln
10.71%
jan 1, 2003
178.332 bln
+210.0 mln
0.12%
jan 1, 2004
200.78 bln
+22.448 bln
12.59%
jan 1, 2005
248.498 bln
+47.718 bln
23.77%
jan 1, 2006
277.044 bln
+28.546 bln
11.49%
jan 1, 2007
317.213 bln
+40.169 bln
14.5%
jan 1, 2008
325.697 bln
+8.484 bln
2.67%
jan 1, 2009
375.327 bln
+49.63 bln
15.24%
jan 1, 2010
442.18 bln
+66.853 bln
17.81%
Ranking of countries by current statistics by years


Comments: