29
/
en
AIzaSyAYiBZKx7MnpbEhh9jyipgxe19OcubqV5w
April 1, 2024
78164
Bangladesh
BGD
true
2
1
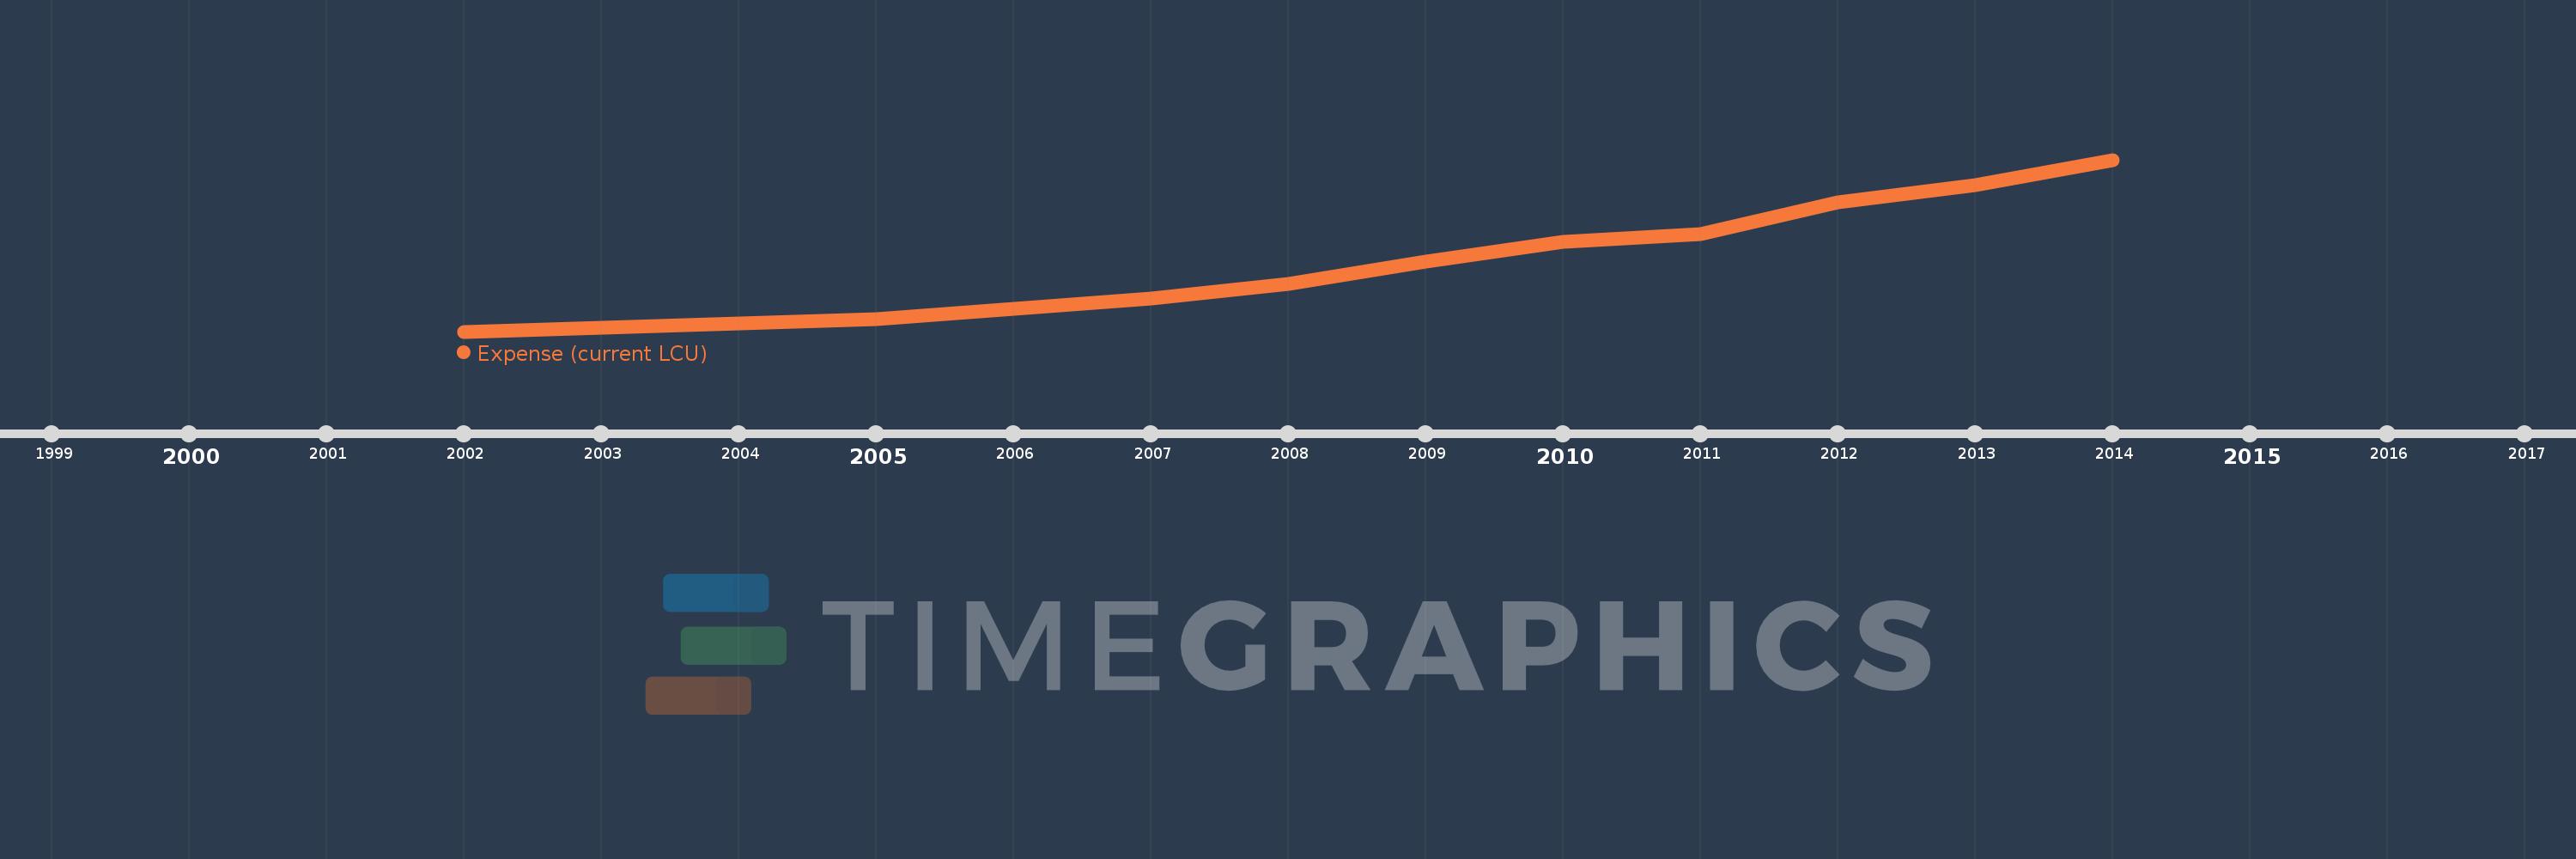
Expense (current LCU)
2014,2013,2012,2011,2010,2009,2008,2007,2006,2005,2004,2003,2002
This statistics in other country:
AfghanistanAlbaniaAlgeriaAngolaAntigua and BarbudaArmeniaAustraliaAustriaAzerbaijanBahamas, TheBahrainBangladeshBarbadosBelarusBelgiumBelizeBeninBhutanBoliviaBosnia and HerzegovinaBotswanaBrazilBulgariaBurkina FasoBurundiCabo VerdeCambodiaCanadaCentral African RepublicChileColombiaCongo, Dem. Rep.Congo, Rep.Costa RicaCote d'IvoireCroatiaCyprusCzech RepublicDenmarkDominicaDominican RepublicEgypt, Arab Rep.El SalvadorEquatorial GuineaEstoniaEthiopiaFijiFinlandFranceGambia, TheGeorgiaGermanyGhanaGreeceGrenadaGuatemalaHondurasHong Kong SAR, ChinaHungaryIcelandIndiaIndonesiaIran, Islamic Rep.IraqIrelandIsraelItalyJamaicaJapanJordanKazakhstanKenyaKiribatiKorea, Rep.KuwaitKyrgyz RepublicLao PDRLatviaLebanonLesothoLiberiaLithuaniaLuxembourgMacao SAR, ChinaMacedonia, FYRMadagascarMalawiMalaysiaMaldivesMaliMaltaMauritiusMexicoMicronesia, Fed. Sts.MoldovaMongoliaMoroccoMozambiqueMyanmarNamibiaNepalNetherlandsNew ZealandNicaraguaNigeriaNorwayOmanPakistanPanamaPapua New GuineaParaguayPeruPhilippinesPolandPortugalQatarRomaniaRussian FederationRwandaSamoaSan MarinoSao Tome and PrincipeSenegalSerbiaSeychellesSierra LeoneSingaporeSlovak RepublicSloveniaSolomon IslandsSouth AfricaSpainSri LankaSt. Kitts and NevisSt. LuciaSurinameSwazilandSwedenSwitzerlandSyrian Arab RepublicTajikistanTanzaniaThailandTimor-LesteTogoTrinidad and TobagoTunisiaTurkeyUgandaUkraineUnited Arab EmiratesUnited KingdomUnited StatesUruguayVanuatuVenezuela, RBVietnamWest Bank and GazaYemen, Rep.ZambiaZimbabwe Timeline:
This timeline shows a graph from 2002 to 2014 of Bangladesh. No data until 2001. Number of actual observations by date: 13.
Source name:
World Development Indicators
Source organization:
International Monetary Fund, Government Finance Statistics Yearbook and data files.
Categories, topics:
Public Sector
Last updated:
apr 23, 2017
Indicators value changes by year
Minimum:
228.781 bln
jan 1, 2002
Maximum:
1.124 trl
jan 1, 2014
At the date of observation
Value
Absolute change
Change from previous value
jan 1, 2002
228.781 bln
+228.781 bln
0.0%
jan 1, 2003
247.877 bln
+19.096 bln
8.35%
jan 1, 2004
272.945 bln
+25.069 bln
10.11%
jan 1, 2005
291.494 bln
+18.549 bln
6.8%
jan 1, 2006
347.751 bln
+56.256 bln
19.3%
jan 1, 2007
402.025 bln
+54.274 bln
15.61%
jan 1, 2008
476.28 bln
+74.255 bln
18.47%
jan 1, 2009
592.771 bln
+116.491 bln
24.46%
jan 1, 2010
696.018 bln
+103.247 bln
17.42%
jan 1, 2011
739.019 bln
+43.002 bln
6.18%
jan 1, 2012
901.49 bln
+162.471 bln
21.98%
jan 1, 2013
992.163 bln
+90.673 bln
10.06%
jan 1, 2014
1.124 trl
+132.237 bln
13.33%
Ranking of countries by current statistics by years


Comments: