29
/
en
AIzaSyAYiBZKx7MnpbEhh9jyipgxe19OcubqV5w
April 1, 2024
93931
Bulgaria
BGR
true
2
1
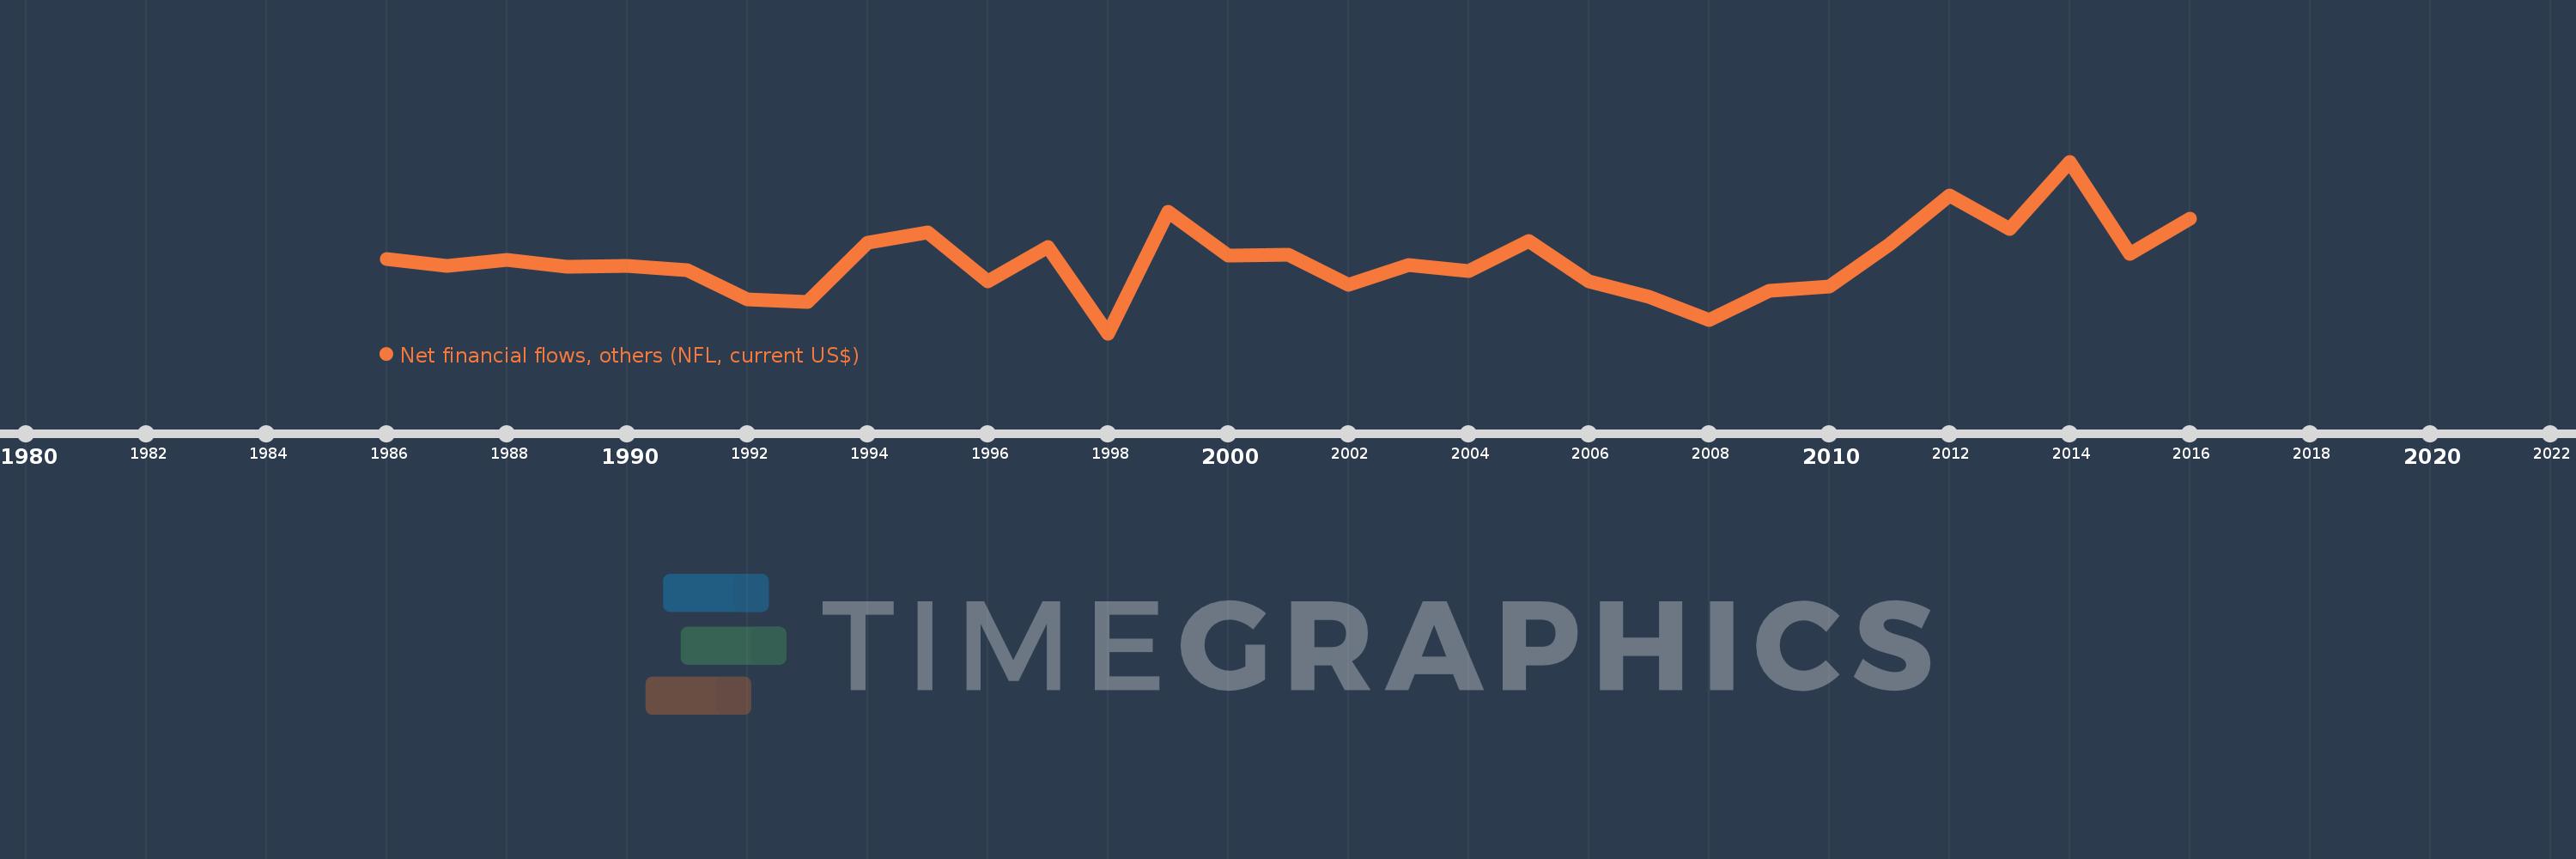
Net financial flows, others (NFL, current US$)
2016,2015,2014,2013,2012,2011,2010,2009,2008,2007,2006,2005,2004,2003,2002,2001,2000,1999,1998,1997,1996,1995,1994,1993,1992,1991,1990,1989,1988,1987,1986
This statistics in other country:
Timeline:
This timeline shows a graph from 1986 to 2016 of Bulgaria. No data until 1985. Number of actual observations by date: 31.
Source name:
World Development Indicators
Source organization:
World Bank, International Debt Statistics.
Categories, topics:
External Debt
Last updated:
apr 23, 2017
Indicators value changes by year
Minimum:
-109.566 mln
jan 1, 1998
Maximum:
244.722 mln
jan 1, 2014
At the date of observation
Value
Absolute change
Change from previous value
jan 1, 1986
43.084 mln
+43.084 mln
0.0%
jan 1, 1987
29.894 mln
-13.19 mln
-30.61%
jan 1, 1988
42.199 mln
+12.305 mln
41.16%
jan 1, 1989
27.148 mln
-15.051 mln
-35.67%
jan 1, 1990
29.74 mln
+2.592 mln
9.55%
jan 1, 1991
21.353 mln
-8.387 mln
-28.2%
jan 1, 1992
-39.199 mln
-60.552 mln
-283.58%
jan 1, 1993
-44.835 mln
-5.636 mln
14.38%
jan 1, 1994
76.981 mln
+121.816 mln
-271.7%
jan 1, 1995
99.19 mln
+22.209 mln
28.85%
jan 1, 1996
-1.794 mln
-100.984 mln
-101.81%
jan 1, 1997
67.646 mln
+69.44 mln
-3.87K%
jan 1, 1998
-109.566 mln
-177.212 mln
-261.97%
jan 1, 1999
140.493 mln
+250.059 mln
-228.23%
jan 1, 2000
50.33 mln
-90.163 mln
-64.18%
jan 1, 2001
52.779 mln
+2.449 mln
4.87%
jan 1, 2002
-10.04 mln
-62.819 mln
-119.02%
jan 1, 2003
30.615 mln
+40.655 mln
-404.93%
jan 1, 2004
18.422 mln
-12.193 mln
-39.83%
jan 1, 2005
80.582 mln
+62.16 mln
337.42%
jan 1, 2006
-1.673 mln
-82.255 mln
-102.08%
jan 1, 2007
-35.104 mln
-33.431 mln
2.0K%
jan 1, 2008
-81.224 mln
-46.12 mln
131.38%
jan 1, 2009
-22.002 mln
+59.222 mln
-72.91%
jan 1, 2010
-12.145 mln
+9.857 mln
-44.8%
jan 1, 2011
73.043 mln
+85.188 mln
-701.42%
jan 1, 2012
174.795 mln
+101.752 mln
139.3%
jan 1, 2013
105.824 mln
-68.971 mln
-39.46%
jan 1, 2014
244.722 mln
+138.898 mln
131.25%
jan 1, 2015
53.841 mln
-190.881 mln
-78.0%
jan 1, 2016
126.781 mln
+72.94 mln
135.47%
Ranking of countries by current statistics by years


Comments: