29
/
en
AIzaSyAYiBZKx7MnpbEhh9jyipgxe19OcubqV5w
April 1, 2024
68083
Angola
AGO
true
2
1
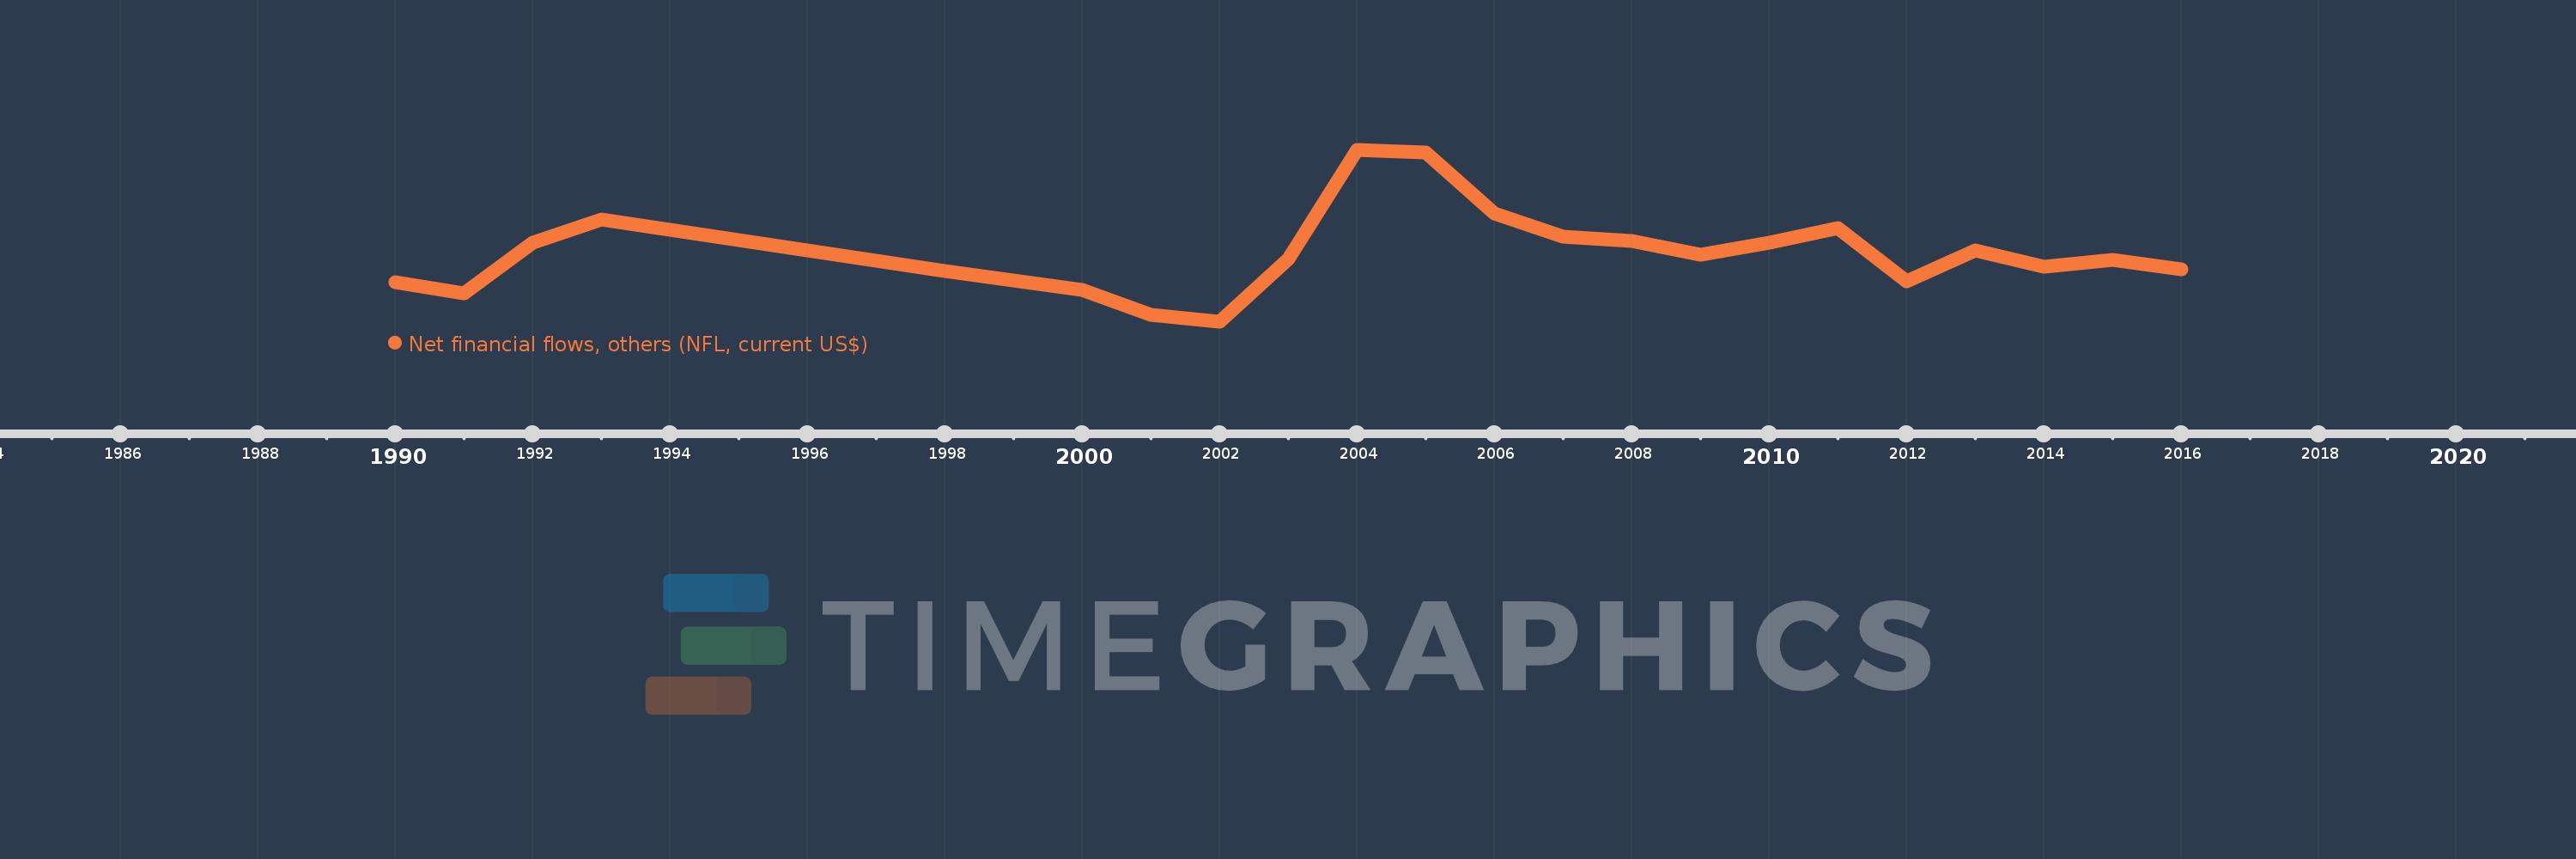
Net financial flows, others (NFL, current US$)
2016,2015,2014,2013,2012,2011,2010,2009,2008,2007,2006,2005,2004,2003,2002,2001,2000,1998,1993,1992,1991,1990
This statistics in other country:
Timeline:
This timeline shows a graph from 1990 to 2016 of Angola. No data until 1989. Number of actual observations by date: 22.
Source name:
World Development Indicators
Source organization:
World Bank, International Debt Statistics.
Categories, topics:
External Debt
Last updated:
apr 23, 2017
Indicators value changes by year
Minimum:
-2.643 mln
jan 1, 2002
Maximum:
4.367 mln
jan 1, 2004
At the date of observation
Value
Absolute change
Change from previous value
jan 1, 1990
-1.016 mln
-1.016 mln
0.0%
jan 1, 1991
-1.468 mln
-452.0K
44.49%
jan 1, 1992
588.0K
+2.056 mln
-140.05%
jan 1, 1993
1.534 mln
+946.0K
160.88%
jan 1, 1998
-572.0K
-2.106 mln
-137.29%
jan 1, 2000
-1.338 mln
-766.0K
133.92%
jan 1, 2001
-2.357 mln
-1.019 mln
76.16%
jan 1, 2002
-2.643 mln
-286.0K
12.13%
jan 1, 2003
-67.0K
+2.576 mln
-97.47%
jan 1, 2004
4.367 mln
+4.434 mln
-6.62K%
jan 1, 2005
4.278 mln
-89.0K
-2.04%
jan 1, 2006
1.788 mln
-2.49 mln
-58.2%
jan 1, 2007
829.0K
-959.0K
-53.64%
jan 1, 2008
658.0K
-171.0K
-20.63%
jan 1, 2009
112.0K
-546.0K
-82.98%
jan 1, 2010
577.0K
+465.0K
415.18%
jan 1, 2011
1.195 mln
+618.0K
107.11%
jan 1, 2012
-983.0K
-2.178 mln
-182.26%
jan 1, 2013
273.0K
+1.256 mln
-127.77%
jan 1, 2014
-372.0K
-645.0K
-236.26%
jan 1, 2015
-107.0K
+265.0K
-71.24%
jan 1, 2016
-507.0K
-400.0K
373.83%
Ranking of countries by current statistics by years


Comments: