29
/
en
AIzaSyAYiBZKx7MnpbEhh9jyipgxe19OcubqV5w
April 1, 2024
232512
Samoa
WSM
true
2
1
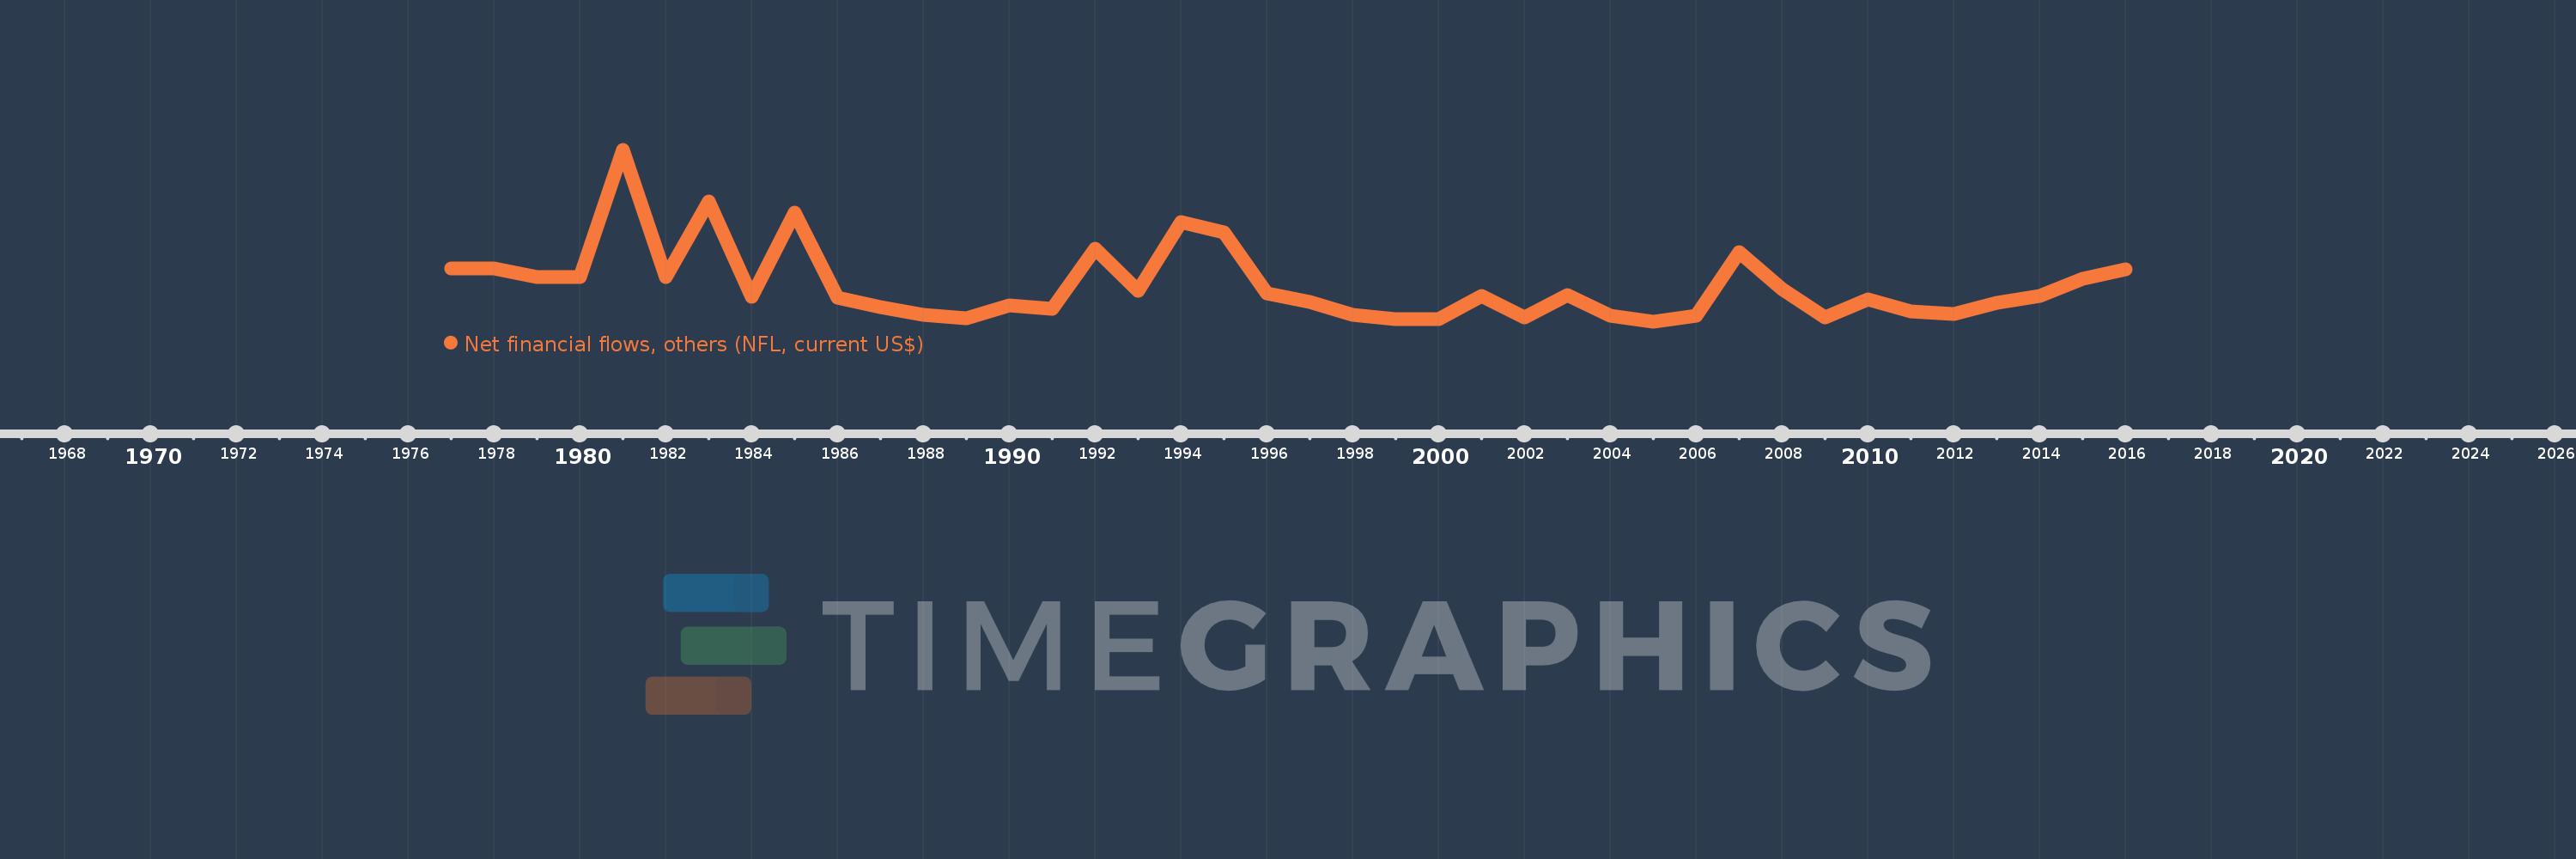
Net financial flows, others (NFL, current US$)
2016,2015,2014,2013,2012,2011,2010,2009,2008,2007,2006,2005,2004,2003,2002,2001,2000,1999,1998,1997,1996,1995,1994,1993,1992,1991,1990,1989,1988,1987,1986,1985,1984,1983,1982,1981,1980,1979,1978,1977
This statistics in other country:
Timeline:
This timeline shows a graph from 1977 to 2016 of Samoa. No data until 1976. Number of actual observations by date: 40.
Source name:
World Development Indicators
Source organization:
World Bank, International Debt Statistics.
Categories, topics:
External Debt
Last updated:
apr 23, 2017
Indicators value changes by year
Minimum:
-1.054 mln
jan 1, 2005
Maximum:
4.866 mln
jan 1, 1981
At the date of observation
Value
Absolute change
Change from previous value
jan 1, 1977
800.0K
+800.0K
0.0%
jan 1, 1978
800.0K
0.0
0.0%
jan 1, 1979
500.0K
-300.0K
-37.5%
jan 1, 1980
500.0K
0.0
0.0%
jan 1, 1981
4.866 mln
+4.366 mln
873.2%
jan 1, 1982
496.0K
-4.37 mln
-89.81%
jan 1, 1983
3.11 mln
+2.614 mln
527.02%
jan 1, 1984
-192.0K
-3.302 mln
-106.17%
jan 1, 1985
2.708 mln
+2.9 mln
-1.51K%
jan 1, 1986
-211.0K
-2.919 mln
-107.79%
jan 1, 1987
-532.0K
-321.0K
152.13%
jan 1, 1988
-794.0K
-262.0K
49.25%
jan 1, 1989
-921.0K
-127.0K
15.99%
jan 1, 1990
-475.0K
+446.0K
-48.43%
jan 1, 1991
-604.0K
-129.0K
27.16%
jan 1, 1992
1.472 mln
+2.076 mln
-343.71%
jan 1, 1993
29.0K
-1.443 mln
-98.03%
jan 1, 1994
2.4 mln
+2.371 mln
8.18K%
jan 1, 1995
2.022 mln
-378.0K
-15.75%
jan 1, 1996
-73.0K
-2.095 mln
-103.61%
jan 1, 1997
-372.0K
-299.0K
409.59%
jan 1, 1998
-809.0K
-437.0K
117.47%
jan 1, 1999
-965.0K
-156.0K
19.28%
jan 1, 2000
-957.0K
+8.0K
-0.83%
jan 1, 2001
-165.0K
+792.0K
-82.76%
jan 1, 2002
-895.0K
-730.0K
442.42%
jan 1, 2003
-138.0K
+757.0K
-84.58%
jan 1, 2004
-833.0K
-695.0K
503.62%
jan 1, 2005
-1.054 mln
-221.0K
26.53%
jan 1, 2006
-837.0K
+217.0K
-20.59%
jan 1, 2007
1.351 mln
+2.188 mln
-261.41%
jan 1, 2008
67.0K
-1.284 mln
-95.04%
jan 1, 2009
-906.0K
-973.0K
-1.45K%
jan 1, 2010
-287.0K
+619.0K
-68.32%
jan 1, 2011
-687.0K
-400.0K
139.37%
jan 1, 2012
-783.0K
-96.0K
13.97%
jan 1, 2013
-389.0K
+394.0K
-50.32%
jan 1, 2014
-159.0K
+230.0K
-59.13%
jan 1, 2015
425.0K
+584.0K
-367.3%
jan 1, 2016
773.0K
+348.0K
81.88%
Ranking of countries by current statistics by years


Comments: