29
/
en
AIzaSyAYiBZKx7MnpbEhh9jyipgxe19OcubqV5w
April 1, 2024
138400
Georgia
GEO
true
2
1
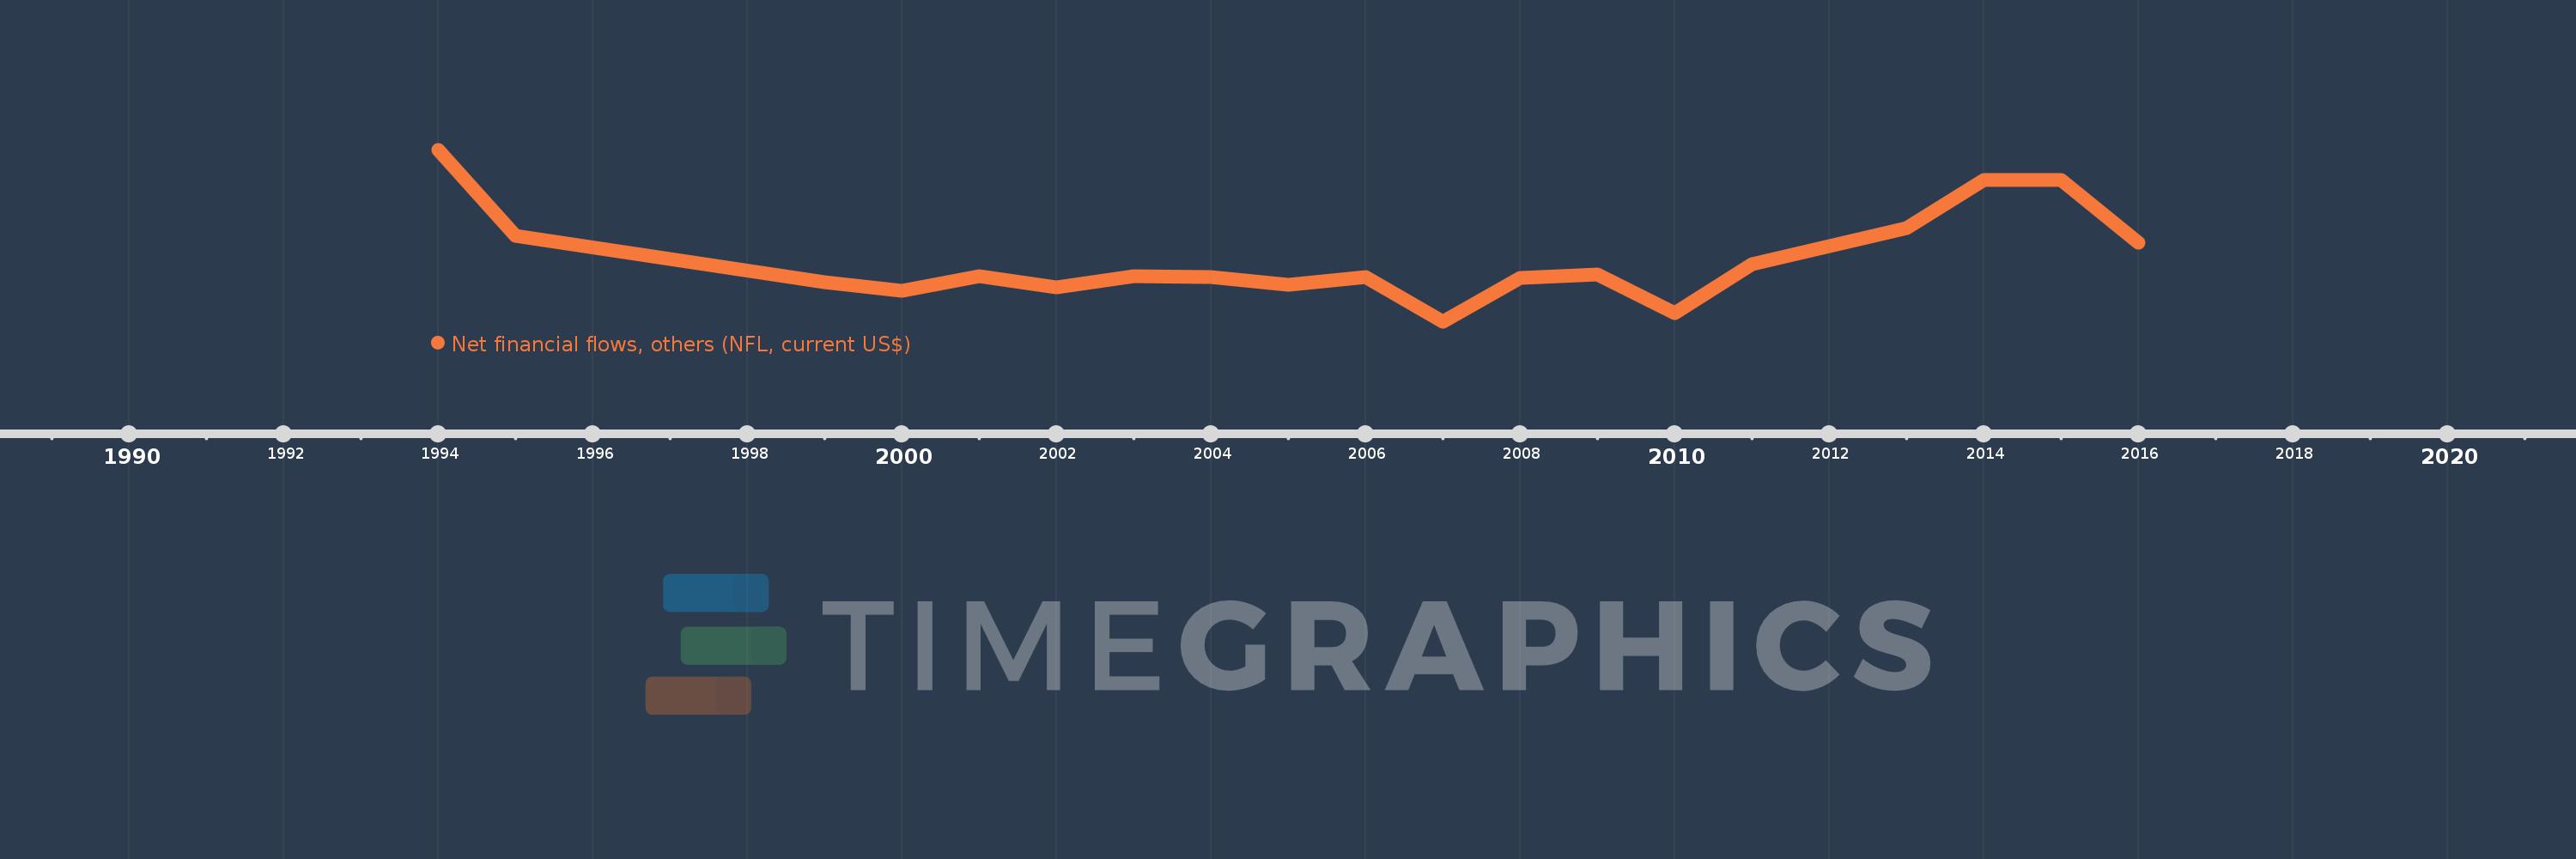
Net financial flows, others (NFL, current US$)
2016,2015,2014,2013,2012,2011,2010,2009,2008,2007,2006,2005,2004,2003,2002,2001,2000,1999,1995,1994
This statistics in other country:
Timeline:
This timeline shows a graph from 1994 to 2016 of Georgia. No data until 1993. Number of actual observations by date: 20.
Source name:
World Development Indicators
Source organization:
World Bank, International Debt Statistics.
Categories, topics:
External Debt
Last updated:
apr 23, 2017
Indicators value changes by year
Minimum:
-34.534 mln
jan 1, 2007
Maximum:
100.734 mln
jan 1, 1994
At the date of observation
Value
Absolute change
Change from previous value
jan 1, 1994
100.734 mln
+100.734 mln
0.0%
jan 1, 1995
33.248 mln
-67.486 mln
-66.99%
jan 1, 1999
-3.263 mln
-36.511 mln
-109.81%
jan 1, 2000
-9.835 mln
-6.572 mln
201.41%
jan 1, 2001
1.195 mln
+11.03 mln
-112.15%
jan 1, 2002
-6.973 mln
-8.168 mln
-683.51%
jan 1, 2003
1.186 mln
+8.159 mln
-117.01%
jan 1, 2004
1.105 mln
-81.0K
-6.83%
jan 1, 2005
-5.11 mln
-6.215 mln
-562.44%
jan 1, 2006
623.0K
+5.733 mln
-112.19%
jan 1, 2007
-34.534 mln
-35.157 mln
-5.64K%
jan 1, 2008
273.0K
+34.807 mln
-100.79%
jan 1, 2009
2.824 mln
+2.551 mln
934.43%
jan 1, 2010
-27.574 mln
-30.398 mln
-1.08K%
jan 1, 2011
11.241 mln
+38.815 mln
-140.77%
jan 1, 2012
25.341 mln
+14.1 mln
125.43%
jan 1, 2013
39.094 mln
+13.753 mln
54.27%
jan 1, 2014
77.269 mln
+38.175 mln
97.65%
jan 1, 2015
77.164 mln
-105.0K
-0.14%
jan 1, 2016
27.836 mln
-49.328 mln
-63.93%
Ranking of countries by current statistics by years


Comments: