29
/
en
AIzaSyAYiBZKx7MnpbEhh9jyipgxe19OcubqV5w
April 1, 2024
98962
Cambodia
KHM
true
2
1
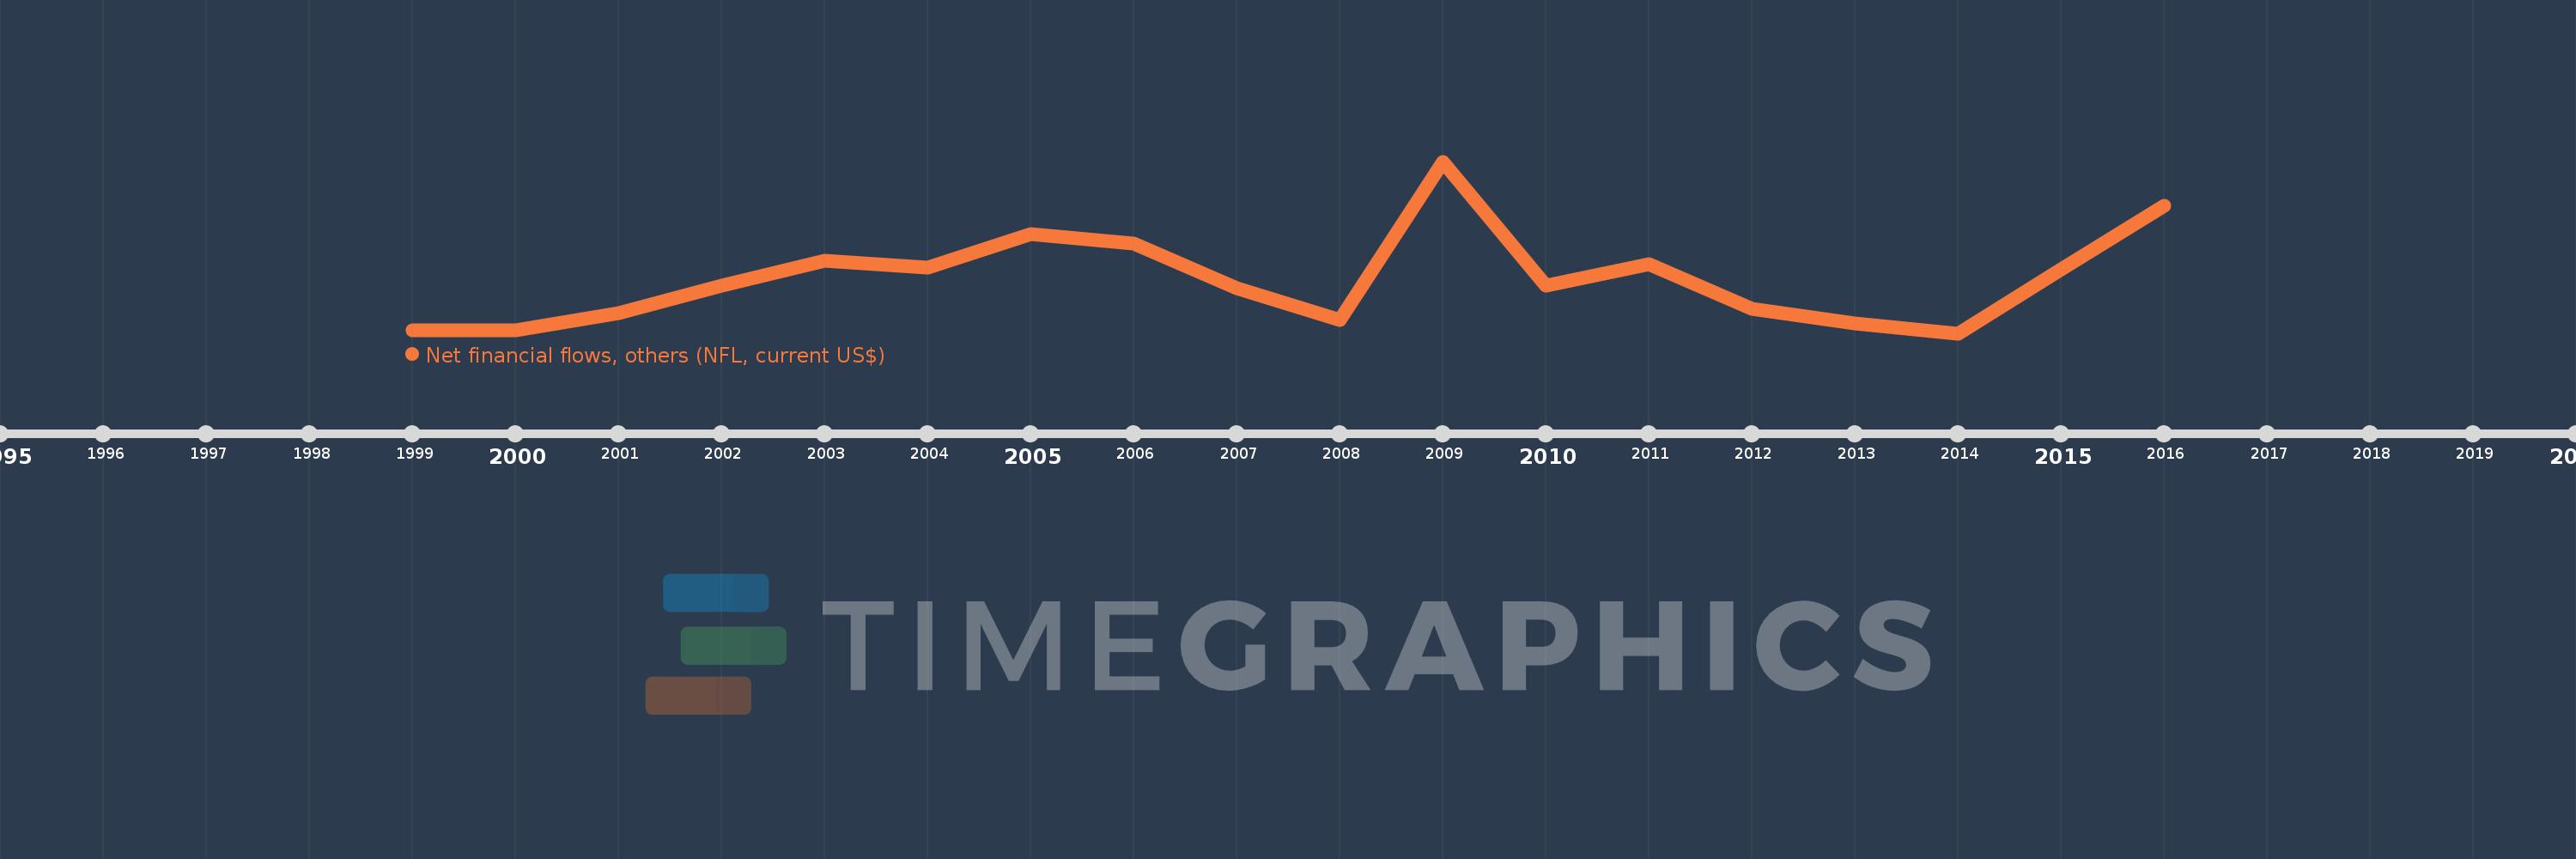
Net financial flows, others (NFL, current US$)
2016,2015,2014,2013,2012,2011,2010,2009,2008,2007,2006,2005,2004,2003,2002,2001,2000,1999
This statistics in other country:
Timeline:
This timeline shows a graph from 1999 to 2016 of Cambodia. No data until 1998. Number of actual observations by date: 18.
Source name:
World Development Indicators
Source organization:
World Bank, International Debt Statistics.
Categories, topics:
External Debt
Last updated:
apr 23, 2017
Indicators value changes by year
Minimum:
-183.0K
jan 1, 2014
Maximum:
16.676 mln
jan 1, 2009
At the date of observation
Value
Absolute change
Change from previous value
jan 1, 1999
100.0K
+100.0K
0.0%
jan 1, 2000
126.0K
+26.0K
26.0%
jan 1, 2001
1.791 mln
+1.665 mln
1.32K%
jan 1, 2002
4.502 mln
+2.711 mln
151.37%
jan 1, 2003
6.973 mln
+2.471 mln
54.89%
jan 1, 2004
6.243 mln
-730.0K
-10.47%
jan 1, 2005
9.547 mln
+3.304 mln
52.92%
jan 1, 2006
8.595 mln
-952.0K
-9.97%
jan 1, 2007
4.278 mln
-4.317 mln
-50.23%
jan 1, 2008
1.092 mln
-3.186 mln
-74.47%
jan 1, 2009
16.676 mln
+15.584 mln
1.43K%
jan 1, 2010
4.476 mln
-12.2 mln
-73.16%
jan 1, 2011
6.588 mln
+2.112 mln
47.18%
jan 1, 2012
2.191 mln
-4.397 mln
-66.74%
jan 1, 2013
813.0K
-1.378 mln
-62.89%
jan 1, 2014
-183.0K
-996.0K
-122.51%
jan 1, 2015
6.126 mln
+6.309 mln
-3.45K%
jan 1, 2016
12.295 mln
+6.169 mln
100.7%
Ranking of countries by current statistics by years


Comments: