29
/
en
AIzaSyAYiBZKx7MnpbEhh9jyipgxe19OcubqV5w
April 1, 2024
93110
Brunei Darussalam
BRN
true
2
1
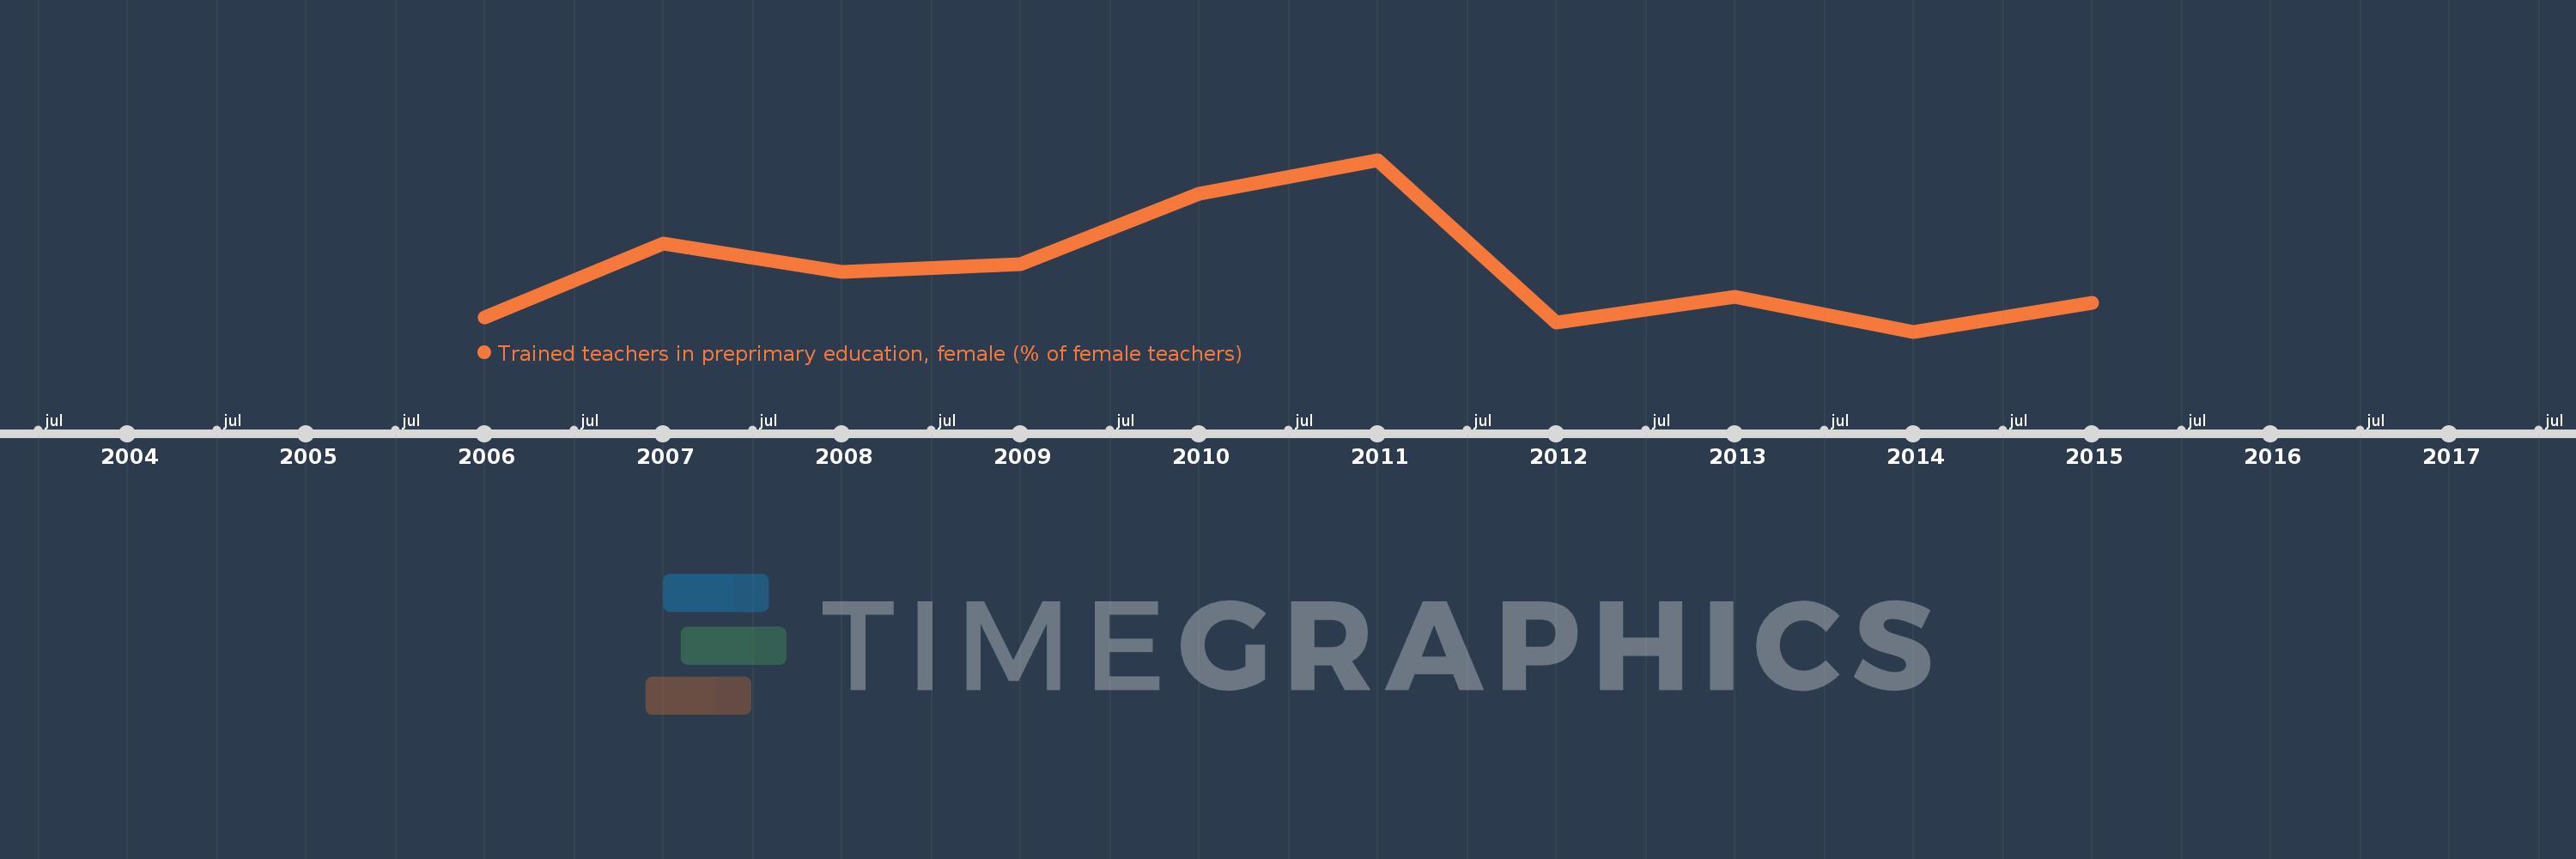
Trained teachers in preprimary education, female (% of female teachers)
2015,2014,2013,2012,2011,2010,2009,2008,2007,2006
This statistics in other country:
Timeline:
This timeline shows a graph from 2006 to 2015 of Brunei Darussalam. No data until 2005. Number of actual observations by date: 10.
Source name:
World Development Indicators
Source organization:
United Nations Educational, Scientific, and Cultural Organization (UNESCO) Institute for Statistics.
Categories, topics:
Education
Last updated:
apr 23, 2017
Indicators value changes by year
Minimum:
62.264
jan 1, 2014
Maximum:
72.291
jan 1, 2011
At the date of observation
Value
Absolute change
Change from previous value
jan 1, 2006
63.105
+63.105
0.0%
jan 1, 2007
67.391
+4.286
6.79%
jan 1, 2008
65.736
-1.656
-2.46%
jan 1, 2009
66.214
+0.478
0.73%
jan 1, 2010
70.313
+4.099
6.19%
jan 1, 2011
72.291
+1.979
2.81%
jan 1, 2012
62.791
-9.5
-13.14%
jan 1, 2013
64.309
+1.519
2.42%
jan 1, 2014
62.264
-2.045
-3.18%
jan 1, 2015
63.926
+1.662
2.67%
Ranking of countries by current statistics by years


Comments: