29
/
en
AIzaSyAYiBZKx7MnpbEhh9jyipgxe19OcubqV5w
April 1, 2024
81355
Belarus
BLR
true
2
1
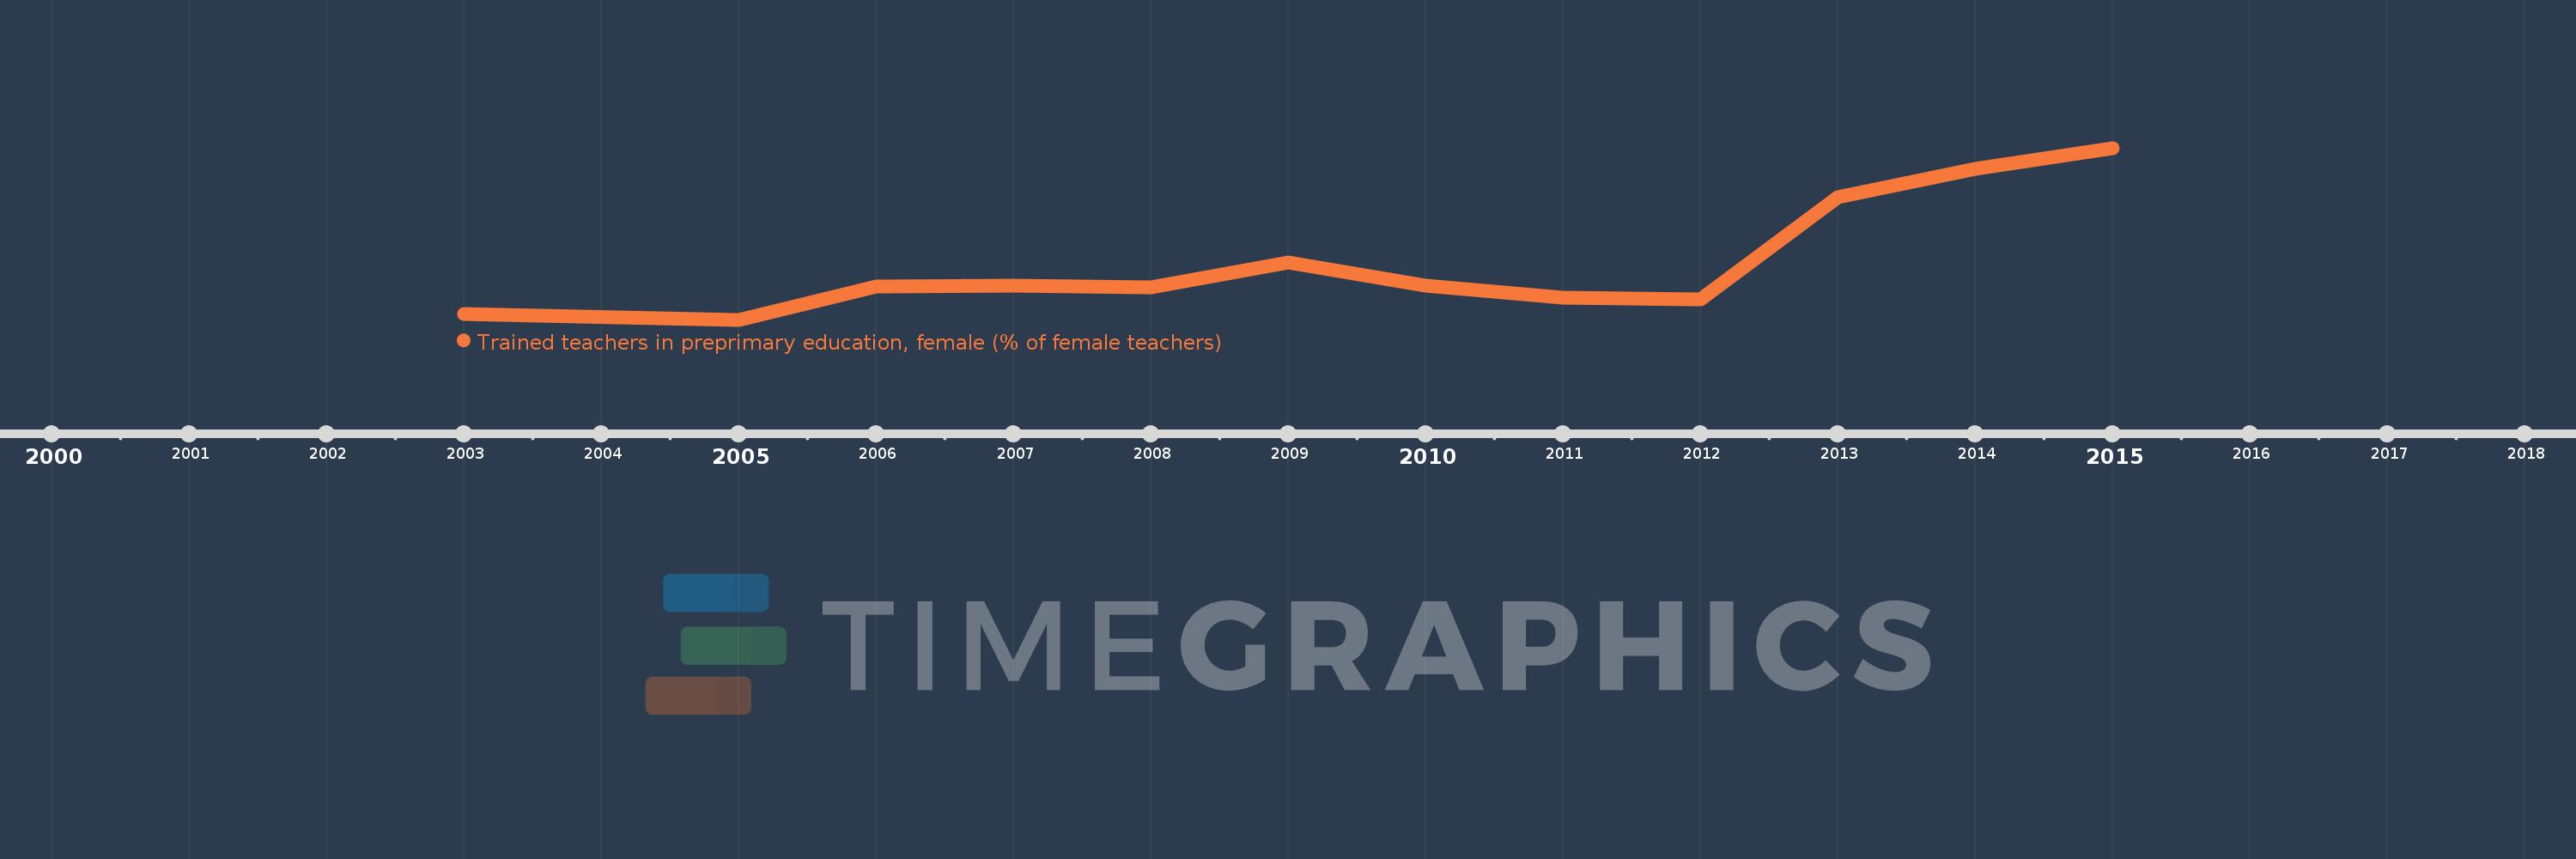
Trained teachers in preprimary education, female (% of female teachers)
2015,2014,2013,2012,2011,2010,2009,2008,2007,2006,2005,2003
This statistics in other country:
Timeline:
This timeline shows a graph from 2003 to 2015 of Belarus. No data until 2002. Number of actual observations by date: 12.
Source name:
World Development Indicators
Source organization:
United Nations Educational, Scientific, and Cultural Organization (UNESCO) Institute for Statistics.
Categories, topics:
Education
Last updated:
apr 23, 2017
Indicators value changes by year
At the date of observation
Value
Absolute change
Change from previous value
jan 1, 2003
58.786
+58.786
0.0%
jan 1, 2005
57.68
-1.106
-1.88%
jan 1, 2006
64.377
+6.697
11.61%
jan 1, 2007
64.536
+0.158
0.25%
jan 1, 2008
64.241
-0.295
-0.46%
jan 1, 2009
69.189
+4.949
7.7%
jan 1, 2010
64.545
-4.644
-6.71%
jan 1, 2011
62.173
-2.372
-3.67%
jan 1, 2012
61.703
-0.47
-0.76%
jan 1, 2013
82.305
+20.602
33.39%
jan 1, 2014
88.01
+5.705
6.93%
jan 1, 2015
92.2
+4.19
4.76%
Ranking of countries by current statistics by years


Comments: