29
/
en
AIzaSyAYiBZKx7MnpbEhh9jyipgxe19OcubqV5w
April 1, 2024
131284
Ethiopia
ETH
true
2
1
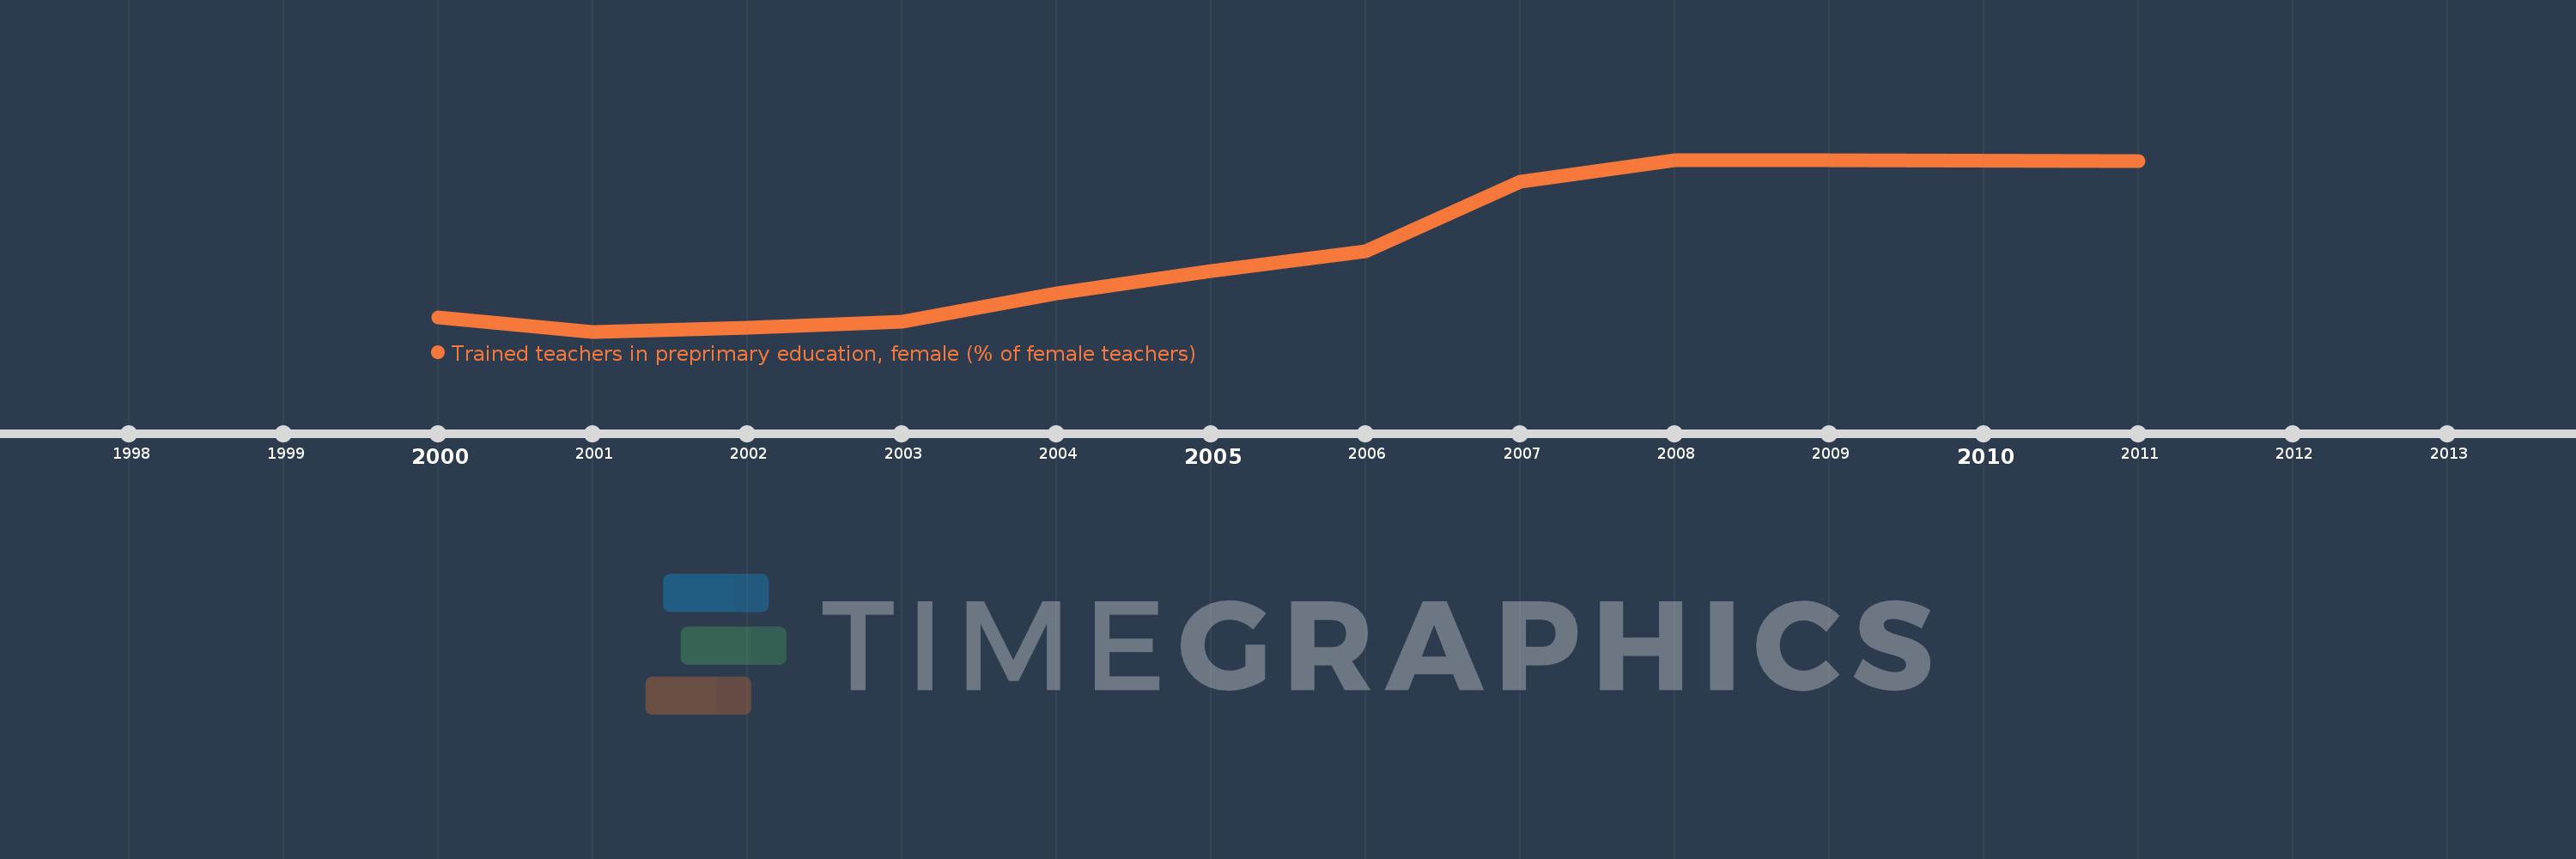
Trained teachers in preprimary education, female (% of female teachers)
2011,2009,2008,2007,2006,2005,2004,2003,2002,2001,2000
This statistics in other country:
Timeline:
This timeline shows a graph from 2000 to 2011 of Ethiopia. No data until 1999. Number of actual observations by date: 11.
Source name:
World Development Indicators
Source organization:
United Nations Educational, Scientific, and Cultural Organization (UNESCO) Institute for Statistics.
Categories, topics:
Education
Last updated:
apr 23, 2017
Indicators value changes by year
Minimum:
62.011
jan 1, 2001
Maximum:
99.939
jan 1, 2009
At the date of observation
Value
Absolute change
Change from previous value
jan 1, 2000
65.146
+65.146
0.0%
jan 1, 2001
62.011
-3.134
-4.81%
jan 1, 2002
62.799
+0.788
1.27%
jan 1, 2003
64.161
+1.362
2.17%
jan 1, 2004
70.499
+6.338
9.88%
jan 1, 2005
75.426
+4.926
6.99%
jan 1, 2006
79.732
+4.307
5.71%
jan 1, 2007
95.188
+15.455
19.38%
jan 1, 2008
99.919
+4.731
4.97%
jan 1, 2009
99.939
+0.021
0.02%
jan 1, 2011
99.588
-0.352
-0.35%
Ranking of countries by current statistics by years


Comments: