29
/
en
AIzaSyAYiBZKx7MnpbEhh9jyipgxe19OcubqV5w
April 1, 2024
212470
Niger
NER
true
2
1
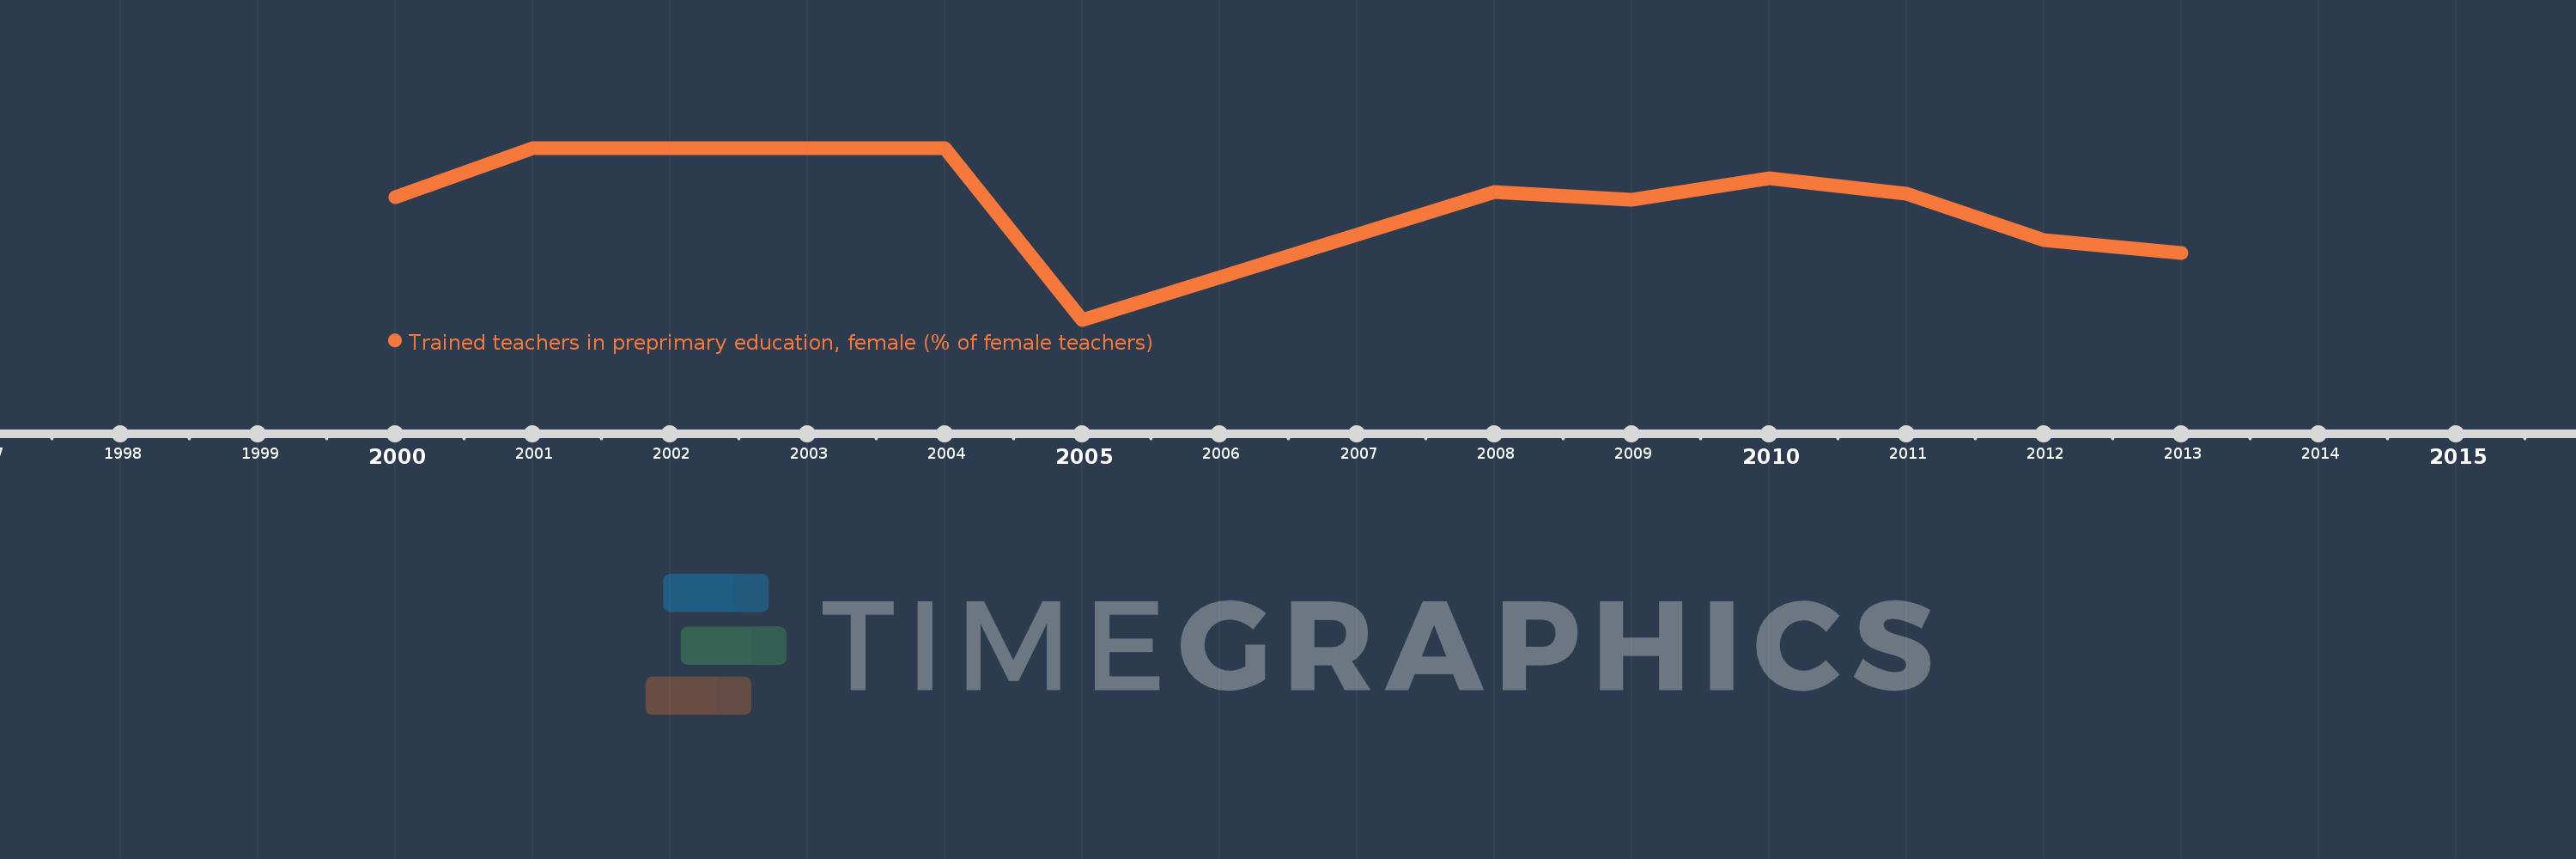
Trained teachers in preprimary education, female (% of female teachers)
2013,2012,2011,2010,2009,2008,2005,2004,2003,2002,2001,2000
This statistics in other country:
Timeline:
This timeline shows a graph from 2000 to 2013 of Niger. No data until 1999. Number of actual observations by date: 12.
Source name:
World Development Indicators
Source organization:
United Nations Educational, Scientific, and Cultural Organization (UNESCO) Institute for Statistics.
Categories, topics:
Education
Last updated:
apr 23, 2017
Indicators value changes by year
Minimum:
85.849
jan 1, 2005
At the date of observation
Value
Absolute change
Change from previous value
jan 1, 2000
95.963
+95.963
0.0%
jan 1, 2001
100.0
+4.037
4.21%
jan 1, 2002
100.0
0.0
0.0%
jan 1, 2003
100.0
0.0
0.0%
jan 1, 2004
100.0
0.0
0.0%
jan 1, 2005
85.849
-14.151
-14.15%
jan 1, 2008
96.341
+10.492
12.22%
jan 1, 2009
95.721
-0.62
-0.64%
jan 1, 2010
97.485
+1.763
1.84%
jan 1, 2011
96.238
-1.247
-1.28%
jan 1, 2012
92.376
-3.861
-4.01%
jan 1, 2013
91.314
-1.062
-1.15%
Ranking of countries by current statistics by years


Comments: