29
/
en
AIzaSyAYiBZKx7MnpbEhh9jyipgxe19OcubqV5w
April 1, 2024
61259
Sub-Saharan Africa (IDA & IBRD countries)
TSS
false
2
1
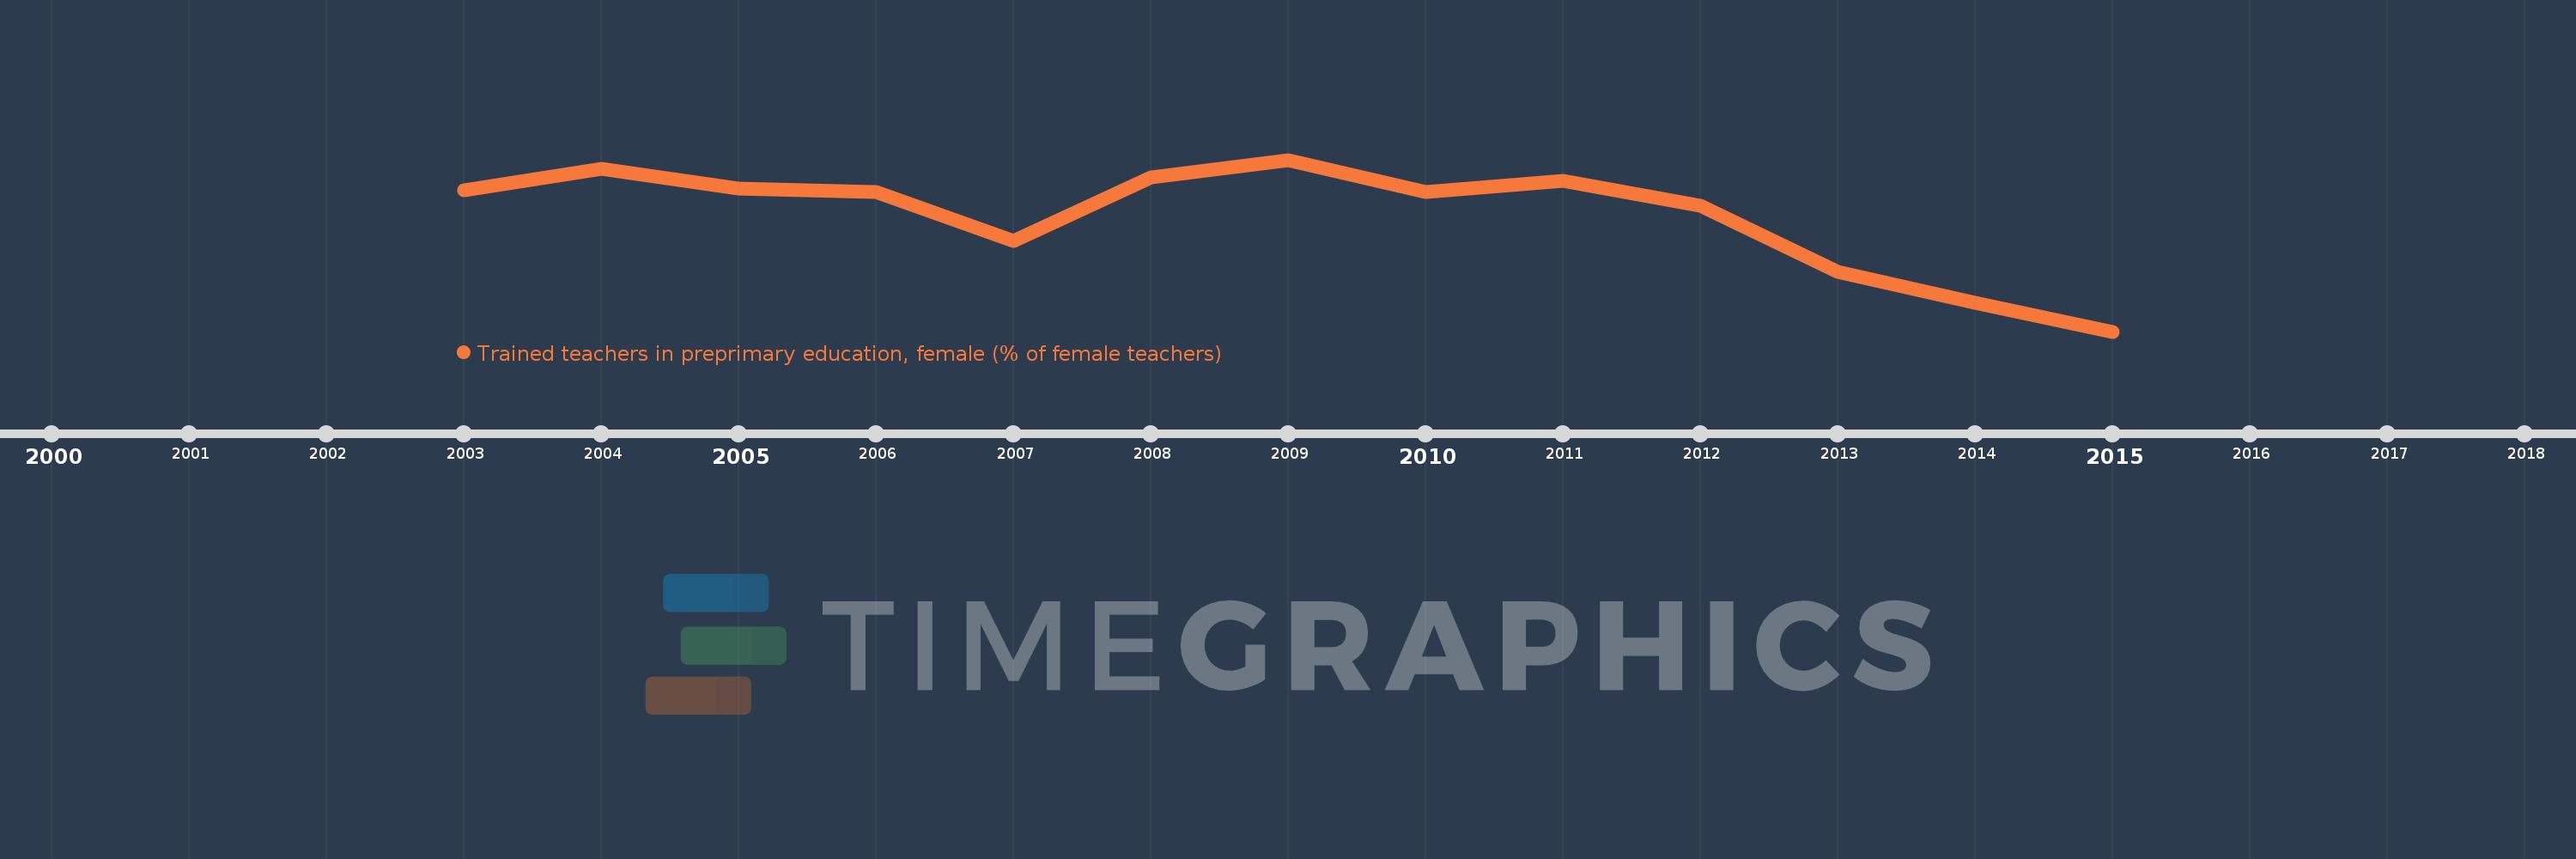
Trained teachers in preprimary education, female (% of female teachers)
2015,2014,2013,2012,2011,2010,2009,2008,2007,2006,2005,2004,2003
This statistics in other country:
Timeline:
This timeline shows a graph from 2003 to 2015 of Sub-Saharan Africa (IDA & IBRD countries). No data until 2002. Number of actual observations by date: 13.
Source name:
World Development Indicators
Source organization:
United Nations Educational, Scientific, and Cultural Organization (UNESCO) Institute for Statistics.
Categories, topics:
Education
Last updated:
apr 23, 2017
Indicators value changes by year
Maximum:
56.892
jan 1, 2009
At the date of observation
Value
Absolute change
Change from previous value
jan 1, 2003
55.084
+55.084
0.0%
jan 1, 2004
56.373
+1.289
2.34%
jan 1, 2005
55.191
-1.182
-2.1%
jan 1, 2006
54.989
-0.202
-0.37%
jan 1, 2007
52.082
-2.907
-5.29%
jan 1, 2008
55.86
+3.778
7.25%
jan 1, 2009
56.892
+1.032
1.85%
jan 1, 2010
54.982
-1.91
-3.36%
jan 1, 2011
55.655
+0.673
1.22%
jan 1, 2012
54.159
-1.496
-2.69%
jan 1, 2013
50.284
-3.876
-7.16%
jan 1, 2014
48.449
-1.835
-3.65%
jan 1, 2015
46.74
-1.709
-3.53%
Ranking of countries by current statistics by years


Comments: