30
/
AIzaSyAYiBZKx7MnpbEhh9jyipgxe19OcubqV5w
April 1, 2024
92172
British Virgin Islands
VGB
true
2
1
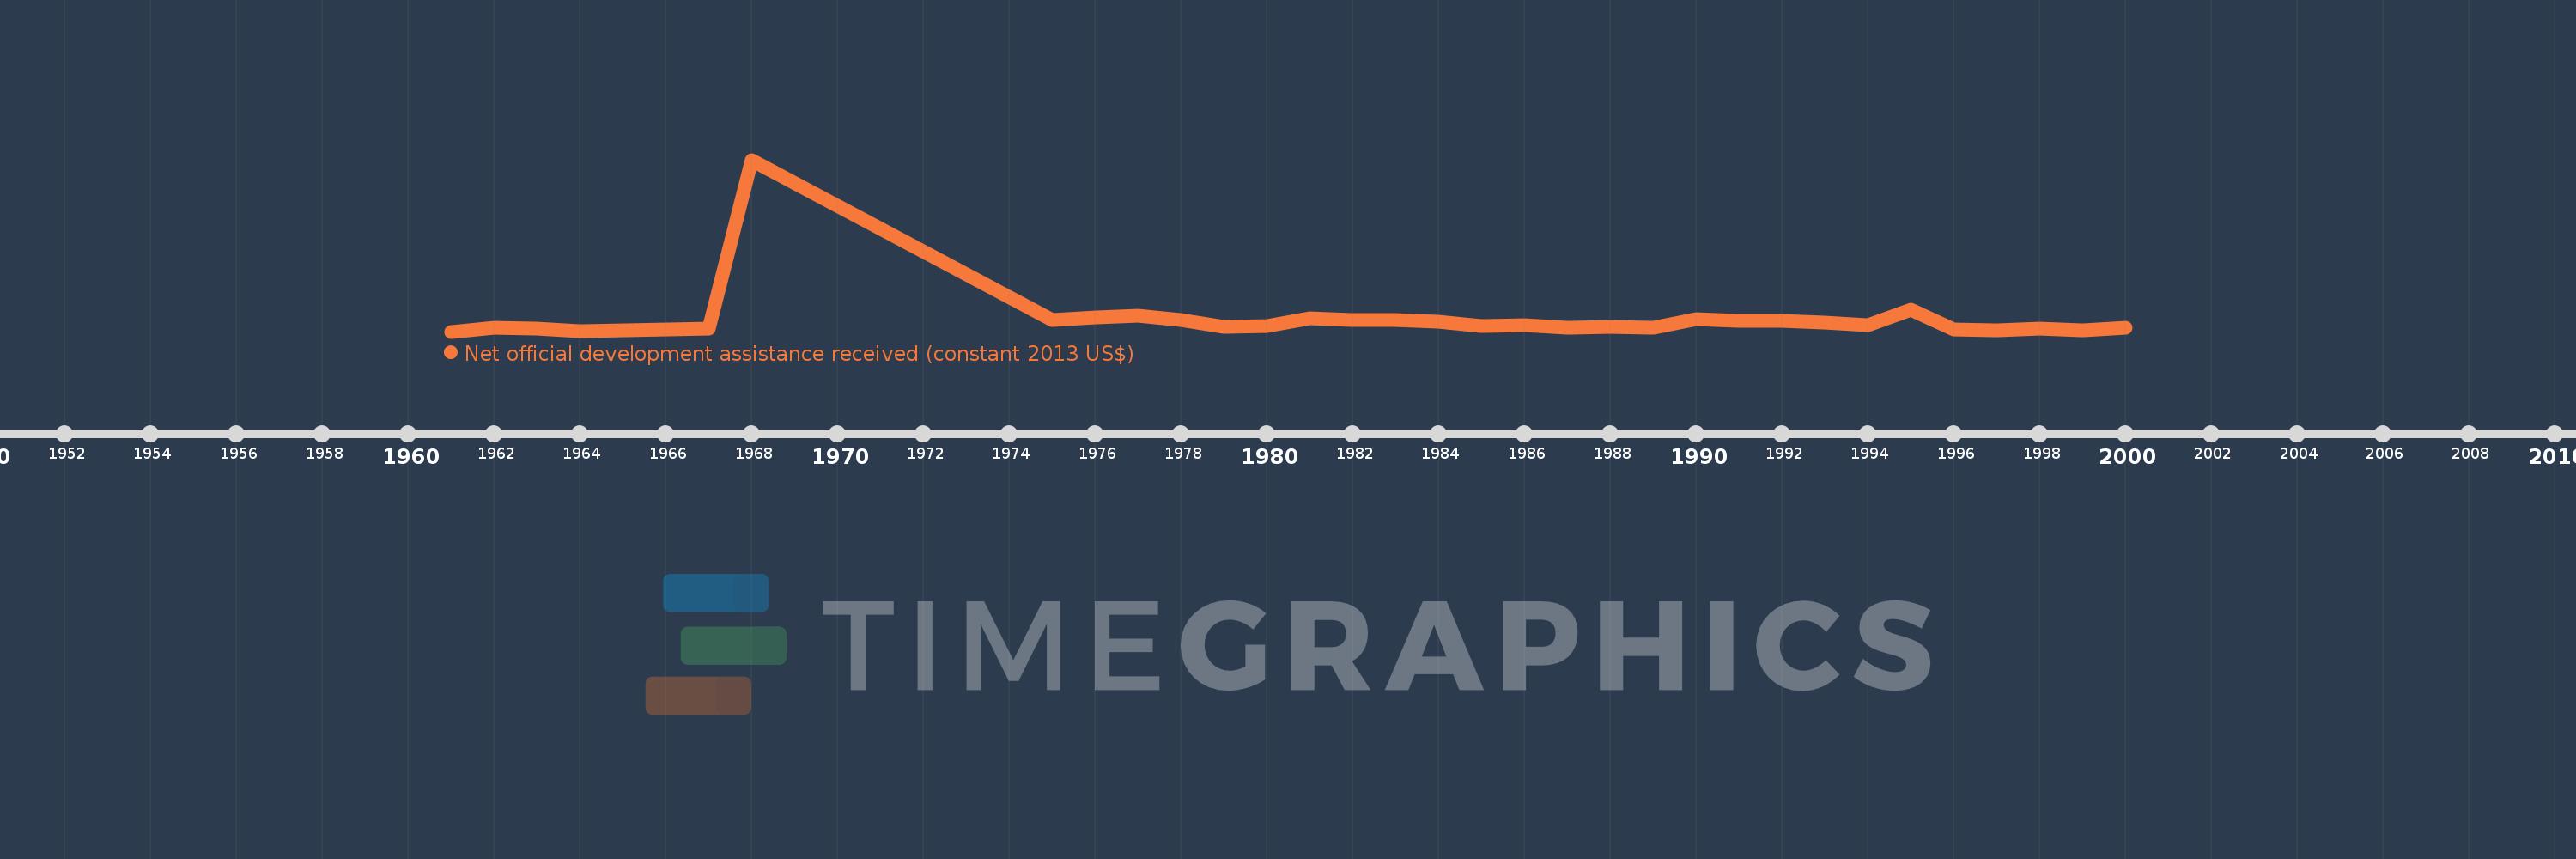
Net official development assistance received (constant 2013 US$)
2000,1999,1998,1997,1996,1995,1994,1993,1992,1991,1990,1989,1988,1987,1986,1985,1984,1983,1982,1981,1980,1979,1978,1977,1976,1975,1968,1967,1965,1964,1963,1962,1961
