29
/
en
AIzaSyAYiBZKx7MnpbEhh9jyipgxe19OcubqV5w
April 1, 2024
52895
OECD members
OED
false
2
1
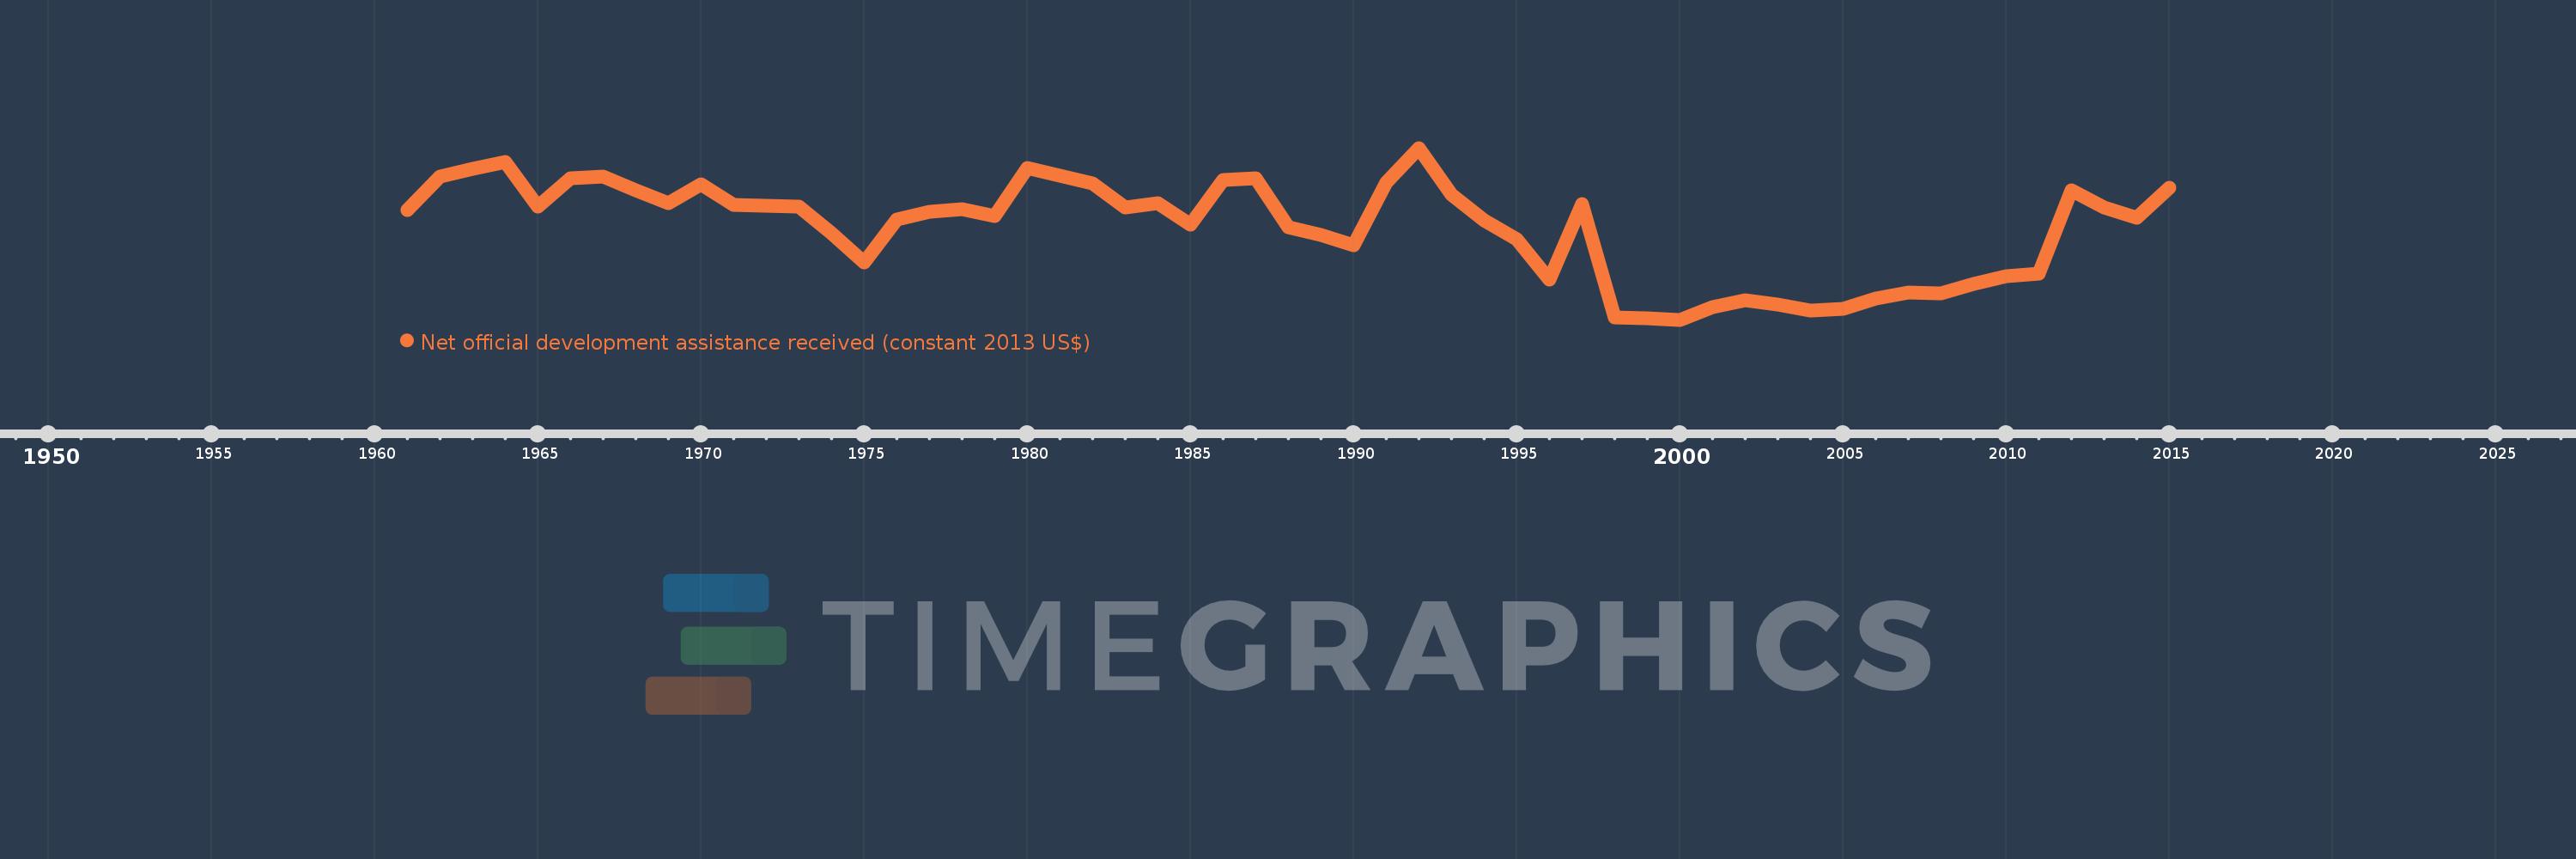
Net official development assistance received (constant 2013 US$)
2015,2014,2013,2012,2011,2010,2009,2008,2007,2006,2005,2004,2003,2002,2001,2000,1999,1998,1997,1996,1995,1994,1993,1992,1991,1990,1989,1988,1987,1986,1985,1984,1983,1982,1981,1980,1979,1978,1977,1976,1975,1974,1973,1972,1971,1970,1969,1968,1967,1966,1965,1964,1963,1962,1961
This statistics in other country:
AfghanistanAlbaniaAlgeriaAngolaAntigua and BarbudaArab WorldArgentinaArmeniaArubaAzerbaijanBahamas, TheBahrainBangladeshBarbadosBelarusBelizeBeninBermudaBhutanBoliviaBosnia and HerzegovinaBotswanaBrazilBritish Virgin IslandsBrunei DarussalamBurkina FasoBurundiCabo VerdeCambodiaCameroonCaribbean small statesCayman IslandsCentral African RepublicCentral Europe and the BalticsChadChileChinaColombiaComorosCongo, Dem. Rep.Congo, Rep.Costa RicaCote d'IvoireCroatiaCubaCyprusDjiboutiDominicaDominican RepublicEast Asia & PacificEast Asia & Pacific (excluding high income)East Asia & Pacific (IDA & IBRD countries)EcuadorEgypt, Arab Rep.El SalvadorEquatorial GuineaEritreaEthiopiaEuro areaEurope & Central AsiaEurope & Central Asia (excluding high income)Europe & Central Asia (IDA & IBRD countries)European UnionFijiFragile and conflict affected situationsFrench PolynesiaGabonGambia, TheGeorgiaGhanaGibraltarGrenadaGuatemalaGuineaGuinea-BissauGuyanaHaitiHeavily indebted poor countries (HIPC)High incomeHondurasHong Kong SAR, ChinaIBRD onlyIDA & IBRD totalIDA blendIDA onlyIDA totalIndiaIndonesiaIran, Islamic Rep.IraqIsraelJamaicaJordanKazakhstanKenyaKiribatiKorea, Dem. People’s Rep.Korea, Rep.KosovoKuwaitKyrgyz RepublicLao PDRLatin America & Caribbean Latin America & Caribbean (excluding high income)Latin America & the Caribbean (IDA & IBRD countries)Least developed countries: UN classificationLebanonLesothoLiberiaLibyaLow & middle incomeLow incomeLower middle incomeMacao SAR, ChinaMacedonia, FYRMadagascarMalawiMalaysiaMaldivesMaliMaltaMarshall IslandsMauritaniaMauritiusMexicoMicronesia, Fed. Sts.Middle East & North AfricaMiddle East & North Africa (excluding high income)Middle East & North Africa (IDA & IBRD countries)Middle incomeMoldovaMongoliaMontenegroMoroccoMozambiqueMyanmarNamibiaNauruNepalNew CaledoniaNicaraguaNigerNigeriaNorth AmericaNorthern Mariana IslandsOECD membersOmanOther small statesPacific island small statesPakistanPalauPanamaPapua New GuineaParaguayPeruPhilippinesQatarRwandaSamoaSao Tome and PrincipeSaudi ArabiaSenegalSerbiaSeychellesSierra LeoneSingaporeSloveniaSmall statesSolomon IslandsSomaliaSouth AfricaSouth AsiaSouth Asia (IDA & IBRD)South SudanSri LankaSt. Kitts and NevisSt. LuciaSt. Vincent and the GrenadinesSub-Saharan Africa Sub-Saharan Africa (excluding high income)Sub-Saharan Africa (IDA & IBRD countries)SudanSurinameSwazilandSyrian Arab RepublicTajikistanTanzaniaThailandTimor-LesteTogoTongaTrinidad and TobagoTunisiaTurkeyTurkmenistanTurks and Caicos IslandsTuvaluUgandaUkraineUnited Arab EmiratesUpper middle incomeUruguayUzbekistanVanuatuVenezuela, RBVietnamWest Bank and GazaWorldYemen, Rep.ZambiaZimbabwe Timeline:
This timeline shows a graph from 1961 to 2015 of OECD members. No data until 1960. Number of actual observations by date: 55.
Source name:
World Development Indicators
Source organization:
Development Assistance Committee of the Organisation for Economic Co-operation and Development, Geographical Distribution of Financial Flows to Developing Countries, Development Co-operation Report, and International Development Statistics database. Data are available online at: www.oecd.org/dac/stats/idsonline.
Categories, topics:
Aid Effectiveness
Last updated:
apr 23, 2017
Indicators value changes by year
Minimum:
224.12 mln
jan 1, 2000
Maximum:
5.701 bln
jan 1, 1992
At the date of observation
Value
Absolute change
Change from previous value
jan 1, 1961
3.722 bln
+3.722 bln
0.0%
jan 1, 1962
4.783 bln
+1.062 bln
28.53%
jan 1, 1963
5.032 bln
+248.26 mln
5.19%
jan 1, 1964
5.243 bln
+211.45 mln
4.2%
jan 1, 1965
3.841 bln
-1.402 bln
-26.74%
jan 1, 1966
4.721 bln
+879.97 mln
22.91%
jan 1, 1967
4.798 bln
+77.61 mln
1.64%
jan 1, 1968
4.353 bln
-444.94 mln
-9.27%
jan 1, 1969
3.952 bln
-401.64 mln
-9.23%
jan 1, 1970
4.532 bln
+579.9 mln
14.67%
jan 1, 1971
3.89 bln
-641.64 mln
-14.16%
jan 1, 1972
3.851 bln
-38.93 mln
-1.0%
jan 1, 1973
3.828 bln
-23.48 mln
-0.61%
jan 1, 1974
2.975 bln
-852.23 mln
-22.26%
jan 1, 1975
2.06 bln
-915.58 mln
-30.77%
jan 1, 1976
3.408 bln
+1.348 bln
65.45%
jan 1, 1977
3.664 bln
+256.08 mln
7.51%
jan 1, 1978
3.748 bln
+83.86 mln
2.29%
jan 1, 1979
3.536 bln
-211.74 mln
-5.65%
jan 1, 1980
5.054 bln
+1.518 bln
42.92%
jan 1, 1981
4.806 bln
-248.23 mln
-4.91%
jan 1, 1982
4.557 bln
-248.46 mln
-5.17%
jan 1, 1983
3.816 bln
-740.94 mln
-16.26%
jan 1, 1984
3.949 bln
+132.35 mln
3.47%
jan 1, 1985
3.244 bln
-704.32 mln
-17.84%
jan 1, 1986
4.674 bln
+1.43 bln
44.08%
jan 1, 1987
4.747 bln
+72.85 mln
1.56%
jan 1, 1988
3.17 bln
-1.577 bln
-33.22%
jan 1, 1989
2.93 bln
-240.57 mln
-7.59%
jan 1, 1990
2.588 bln
-341.36 mln
-11.65%
jan 1, 1991
4.596 bln
+2.007 bln
77.56%
jan 1, 1992
5.701 bln
+1.105 bln
24.05%
jan 1, 1993
4.211 bln
-1.49 bln
-26.14%
jan 1, 1994
3.386 bln
-824.33 mln
-19.58%
jan 1, 1995
2.778 bln
-608.26 mln
-17.96%
jan 1, 1996
1.51 bln
-1.268 bln
-45.65%
jan 1, 1997
3.901 bln
+2.391 bln
158.37%
jan 1, 1998
308.53 mln
-3.592 bln
-92.09%
jan 1, 1999
274.01 mln
-34.52 mln
-11.19%
jan 1, 2000
224.12 mln
-49.89 mln
-18.21%
jan 1, 2001
630.32 mln
+406.2 mln
181.24%
jan 1, 2002
842.61 mln
+212.29 mln
33.68%
jan 1, 2003
700.22 mln
-142.39 mln
-16.9%
jan 1, 2004
508.9 mln
-191.32 mln
-27.32%
jan 1, 2005
563.31 mln
+54.41 mln
10.69%
jan 1, 2006
903.49 mln
+340.18 mln
60.39%
jan 1, 2007
1.084 bln
+180.28 mln
19.95%
jan 1, 2008
1.067 bln
-16.38 mln
-1.51%
jan 1, 2009
1.356 bln
+288.63 mln
27.04%
jan 1, 2010
1.623 bln
+267.2 mln
19.7%
jan 1, 2011
1.701 bln
+77.76 mln
4.79%
jan 1, 2012
4.357 bln
+2.656 bln
156.17%
jan 1, 2013
3.808 bln
-549.55 mln
-12.61%
jan 1, 2014
3.482 bln
-325.58 mln
-8.55%
jan 1, 2015
4.441 bln
+958.37 mln
27.52%
Ranking of countries by current statistics by years


Comments: