29
/
en
AIzaSyAYiBZKx7MnpbEhh9jyipgxe19OcubqV5w
April 1, 2024
30146
Euro area
EMU
false
2
1
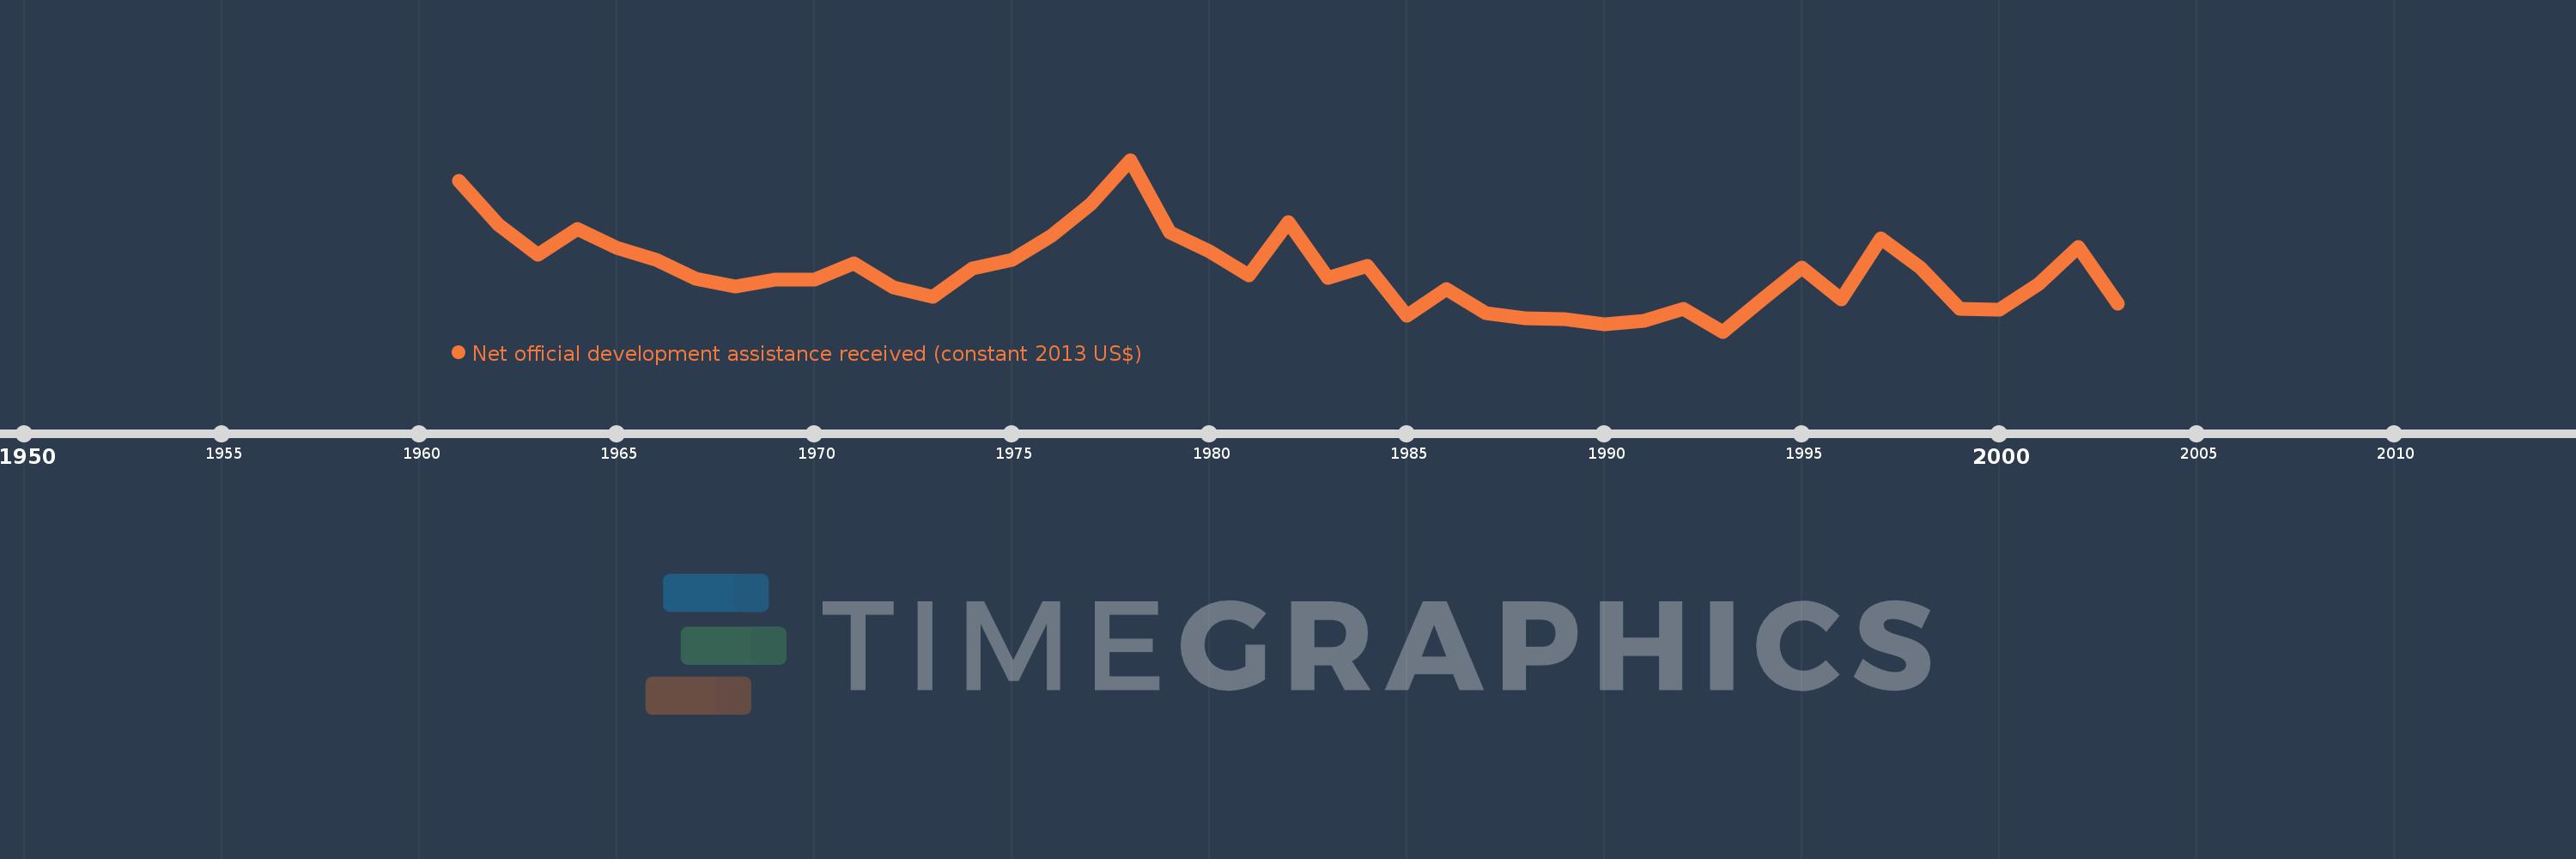
Net official development assistance received (constant 2013 US$)
2003,2002,2001,2000,1999,1998,1997,1996,1995,1994,1993,1992,1991,1990,1989,1988,1987,1986,1985,1984,1983,1982,1981,1980,1979,1978,1977,1976,1975,1974,1973,1972,1971,1970,1969,1968,1967,1966,1965,1964,1963,1962,1961
This statistics in other country:
AfghanistanAlbaniaAlgeriaAngolaAntigua and BarbudaArab WorldArgentinaArmeniaArubaAzerbaijanBahamas, TheBahrainBangladeshBarbadosBelarusBelizeBeninBermudaBhutanBoliviaBosnia and HerzegovinaBotswanaBrazilBritish Virgin IslandsBrunei DarussalamBurkina FasoBurundiCabo VerdeCambodiaCameroonCaribbean small statesCayman IslandsCentral African RepublicCentral Europe and the BalticsChadChileChinaColombiaComorosCongo, Dem. Rep.Congo, Rep.Costa RicaCote d'IvoireCroatiaCubaCyprusDjiboutiDominicaDominican RepublicEast Asia & PacificEast Asia & Pacific (excluding high income)East Asia & Pacific (IDA & IBRD countries)EcuadorEgypt, Arab Rep.El SalvadorEquatorial GuineaEritreaEthiopiaEuro areaEurope & Central AsiaEurope & Central Asia (excluding high income)Europe & Central Asia (IDA & IBRD countries)European UnionFijiFragile and conflict affected situationsFrench PolynesiaGabonGambia, TheGeorgiaGhanaGibraltarGrenadaGuatemalaGuineaGuinea-BissauGuyanaHaitiHeavily indebted poor countries (HIPC)High incomeHondurasHong Kong SAR, ChinaIBRD onlyIDA & IBRD totalIDA blendIDA onlyIDA totalIndiaIndonesiaIran, Islamic Rep.IraqIsraelJamaicaJordanKazakhstanKenyaKiribatiKorea, Dem. People’s Rep.Korea, Rep.KosovoKuwaitKyrgyz RepublicLao PDRLatin America & Caribbean Latin America & Caribbean (excluding high income)Latin America & the Caribbean (IDA & IBRD countries)Least developed countries: UN classificationLebanonLesothoLiberiaLibyaLow & middle incomeLow incomeLower middle incomeMacao SAR, ChinaMacedonia, FYRMadagascarMalawiMalaysiaMaldivesMaliMaltaMarshall IslandsMauritaniaMauritiusMexicoMicronesia, Fed. Sts.Middle East & North AfricaMiddle East & North Africa (excluding high income)Middle East & North Africa (IDA & IBRD countries)Middle incomeMoldovaMongoliaMontenegroMoroccoMozambiqueMyanmarNamibiaNauruNepalNew CaledoniaNicaraguaNigerNigeriaNorth AmericaNorthern Mariana IslandsOECD membersOmanOther small statesPacific island small statesPakistanPalauPanamaPapua New GuineaParaguayPeruPhilippinesQatarRwandaSamoaSao Tome and PrincipeSaudi ArabiaSenegalSerbiaSeychellesSierra LeoneSingaporeSloveniaSmall statesSolomon IslandsSomaliaSouth AfricaSouth AsiaSouth Asia (IDA & IBRD)South SudanSri LankaSt. Kitts and NevisSt. LuciaSt. Vincent and the GrenadinesSub-Saharan Africa Sub-Saharan Africa (excluding high income)Sub-Saharan Africa (IDA & IBRD countries)SudanSurinameSwazilandSyrian Arab RepublicTajikistanTanzaniaThailandTimor-LesteTogoTongaTrinidad and TobagoTunisiaTurkeyTurkmenistanTurks and Caicos IslandsTuvaluUgandaUkraineUnited Arab EmiratesUpper middle incomeUruguayUzbekistanVanuatuVenezuela, RBVietnamWest Bank and GazaWorldYemen, Rep.ZambiaZimbabwe Timeline:
This timeline shows a graph from 1961 to 2003 of Euro area. No data until 1960. Number of actual observations by date: 43.
Source name:
World Development Indicators
Source organization:
Development Assistance Committee of the Organisation for Economic Co-operation and Development, Geographical Distribution of Financial Flows to Developing Countries, Development Co-operation Report, and International Development Statistics database. Data are available online at: www.oecd.org/dac/stats/idsonline.
Categories, topics:
Aid Effectiveness
Last updated:
apr 23, 2017
Indicators value changes by year
Minimum:
45.62 mln
jan 1, 1993
Maximum:
419.03 mln
jan 1, 1978
At the date of observation
Value
Absolute change
Change from previous value
jan 1, 1961
372.39 mln
+372.39 mln
0.0%
jan 1, 1962
278.83 mln
-93.56 mln
-25.12%
jan 1, 1963
212.54 mln
-66.29 mln
-23.77%
jan 1, 1964
269.48 mln
+56.94 mln
26.79%
jan 1, 1965
226.84 mln
-42.64 mln
-15.82%
jan 1, 1966
200.71 mln
-26.13 mln
-11.52%
jan 1, 1967
160.47 mln
-40.24 mln
-20.05%
jan 1, 1968
144.53 mln
-15.94 mln
-9.93%
jan 1, 1969
159.26 mln
+14.73 mln
10.19%
jan 1, 1970
158.11 mln
-1.15 mln
-0.72%
jan 1, 1971
193.51 mln
+35.4 mln
22.39%
jan 1, 1972
142.5 mln
-51.01 mln
-26.36%
jan 1, 1973
121.34 mln
-21.16 mln
-14.85%
jan 1, 1974
182.88 mln
+61.54 mln
50.72%
jan 1, 1975
200.82 mln
+17.94 mln
9.81%
jan 1, 1976
253.91 mln
+53.09 mln
26.44%
jan 1, 1977
323.02 mln
+69.11 mln
27.22%
jan 1, 1978
419.03 mln
+96.01 mln
29.72%
jan 1, 1979
260.85 mln
-158.18 mln
-37.75%
jan 1, 1980
220.36 mln
-40.49 mln
-15.52%
jan 1, 1981
167.37 mln
-52.99 mln
-24.05%
jan 1, 1982
283.4 mln
+116.03 mln
69.33%
jan 1, 1983
163.22 mln
-120.18 mln
-42.41%
jan 1, 1984
188.12 mln
+24.9 mln
15.26%
jan 1, 1985
80.19 mln
-107.93 mln
-57.37%
jan 1, 1986
138.67 mln
+58.48 mln
72.93%
jan 1, 1987
85.27 mln
-53.4 mln
-38.51%
jan 1, 1988
74.96 mln
-10.31 mln
-12.09%
jan 1, 1989
72.16 mln
-2.8 mln
-3.74%
jan 1, 1990
61.08 mln
-11.08 mln
-15.35%
jan 1, 1991
69.35 mln
+8.27 mln
13.54%
jan 1, 1992
95.06 mln
+25.71 mln
37.07%
jan 1, 1993
45.62 mln
-49.44 mln
-52.01%
jan 1, 1994
116.41 mln
+70.79 mln
155.17%
jan 1, 1995
185.6 mln
+69.19 mln
59.44%
jan 1, 1996
114.91 mln
-70.69 mln
-38.09%
jan 1, 1997
248.43 mln
+133.52 mln
116.2%
jan 1, 1998
185.24 mln
-63.19 mln
-25.44%
jan 1, 1999
95.42 mln
-89.82 mln
-48.49%
jan 1, 2000
92.78 mln
-2.64 mln
-2.77%
jan 1, 2001
148.88 mln
+56.1 mln
60.47%
jan 1, 2002
230.13 mln
+81.25 mln
54.57%
jan 1, 2003
106.81 mln
-123.32 mln
-53.59%
Ranking of countries by current statistics by years


Comments: